

In this Q&A, Senior Portfolio Manager Rajesh Gandhi and Senior Client Portfolio Manager Laura Granger discuss the current market environment for non-U.S. equities, noting certain secular trends we believe will continue to support earnings growth.
Key Takeaways
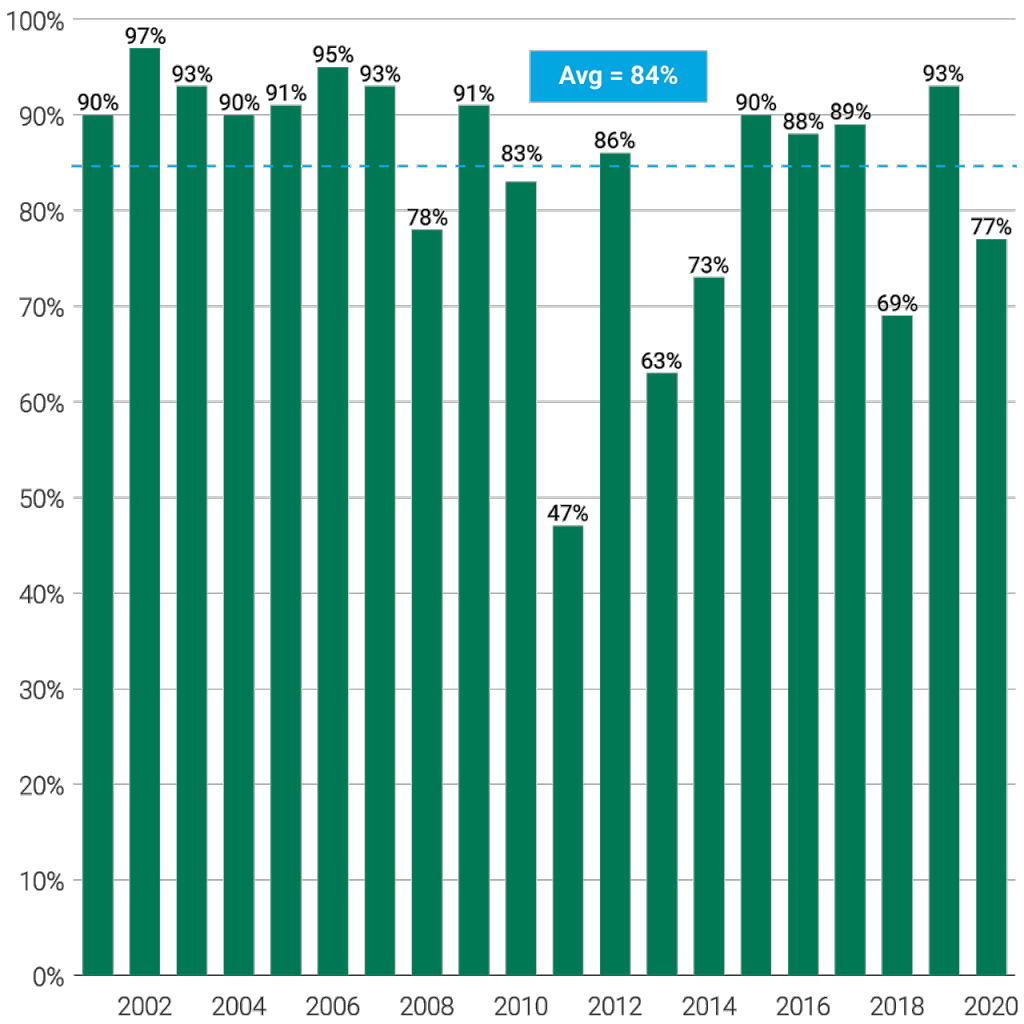
- Evaluating index performance doesn’t tell the full story. Since 2001, on average, international stocks have comprised 84% of the top 100 performing companies in the MSCI ACWI index annually.
- The prolonged outperformance of U.S. equity indices has been supported by a small subset of companies. As global growth broadens, this trend may be poised to turn.
- Relative valuations for non-U.S. equities are compelling, and earnings momentum is inflecting positively.
- We believe cyclical growth rates are peaking, but earnings will remain strong. We anticipate broad-based earnings growth in 2022 and 2023.
- We expect macroeconomic influences to stabilize and earnings to be a key driver of stock price performance. The market should reward stocks for earnings growth and benefit managers demonstrating strong stock selection.
Q: Given that U.S. equities have outperformed international equities by such a wide margin for some time, why should investors consider international stocks?
Rajesh Gandhi: We get this question a lot, and I understand why. U.S. equities have far outperformed those in non-U.S. markets, especially since the Great Financial Crisis.
Many of us who are based in the U.S. can become myopic. The financial press typically highlights U.S. stocks that have generated huge returns over multiple years, fueling the perception that such returns are available only in the U.S.
But our research of the 100 top-performing companies in the MSCI ACWI index (which includes the U.S.) since 2001 revealed that, on average, 84% of these top performers have been non-U.S. stocks. See Figure 1. This demonstrates that a more abundant opportunity set exists outside the U.S. for managers focused on bottom-up stock selection to exploit.
Figure 1 | What Percent of the 100 Top-Performing Global Stocks Are Based Outside the U.S.?
MSCI ACWI
If we dig a little deeper, we see that just five stocks contributed close to two-thirds of this outperformance over the last five years. The Information Technology sector has primarily driven the U.S. market’s outperformance. And within that sector, it’s been a small number of stocks, which comprise only 1% of the 500 firms in the index.
It would take a manager with tremendous skill and resolve to have consistently overweighted these stocks for more than five years. In addition, these stocks had benefited from a global scarcity of growth. The broadening of global earnings growth suggests investors may benefit from diversification.
We believe a disciplined, bottom-up approach to stock selection can help identify non-U.S. stocks that have generated similar, if not greater, returns than that subset of familiar U.S.-based tech companies. While the technology sector has outperformers, such as payment processor Adyen, note that some of these firms, such as LVMH, the Paris-based luxury goods company, and Techtronic, a Hong Kong-based power tool manufacturer (owner of the popular Ryobi and Milwaukee tools brands) are not technology companies. So, non-U.S. markets offer not only more choices but also a more diverse opportunity set.
Q: So, index returns don’t tell the whole story. Do you think this supports the importance of stock selection and taking an actively managed, more concentrated approach in this space?
Gandhi: Well, I may be biased but, yes. The data suggest active management has historically paid off in non-U.S. markets, much more so than in the U.S.
Looking at the three- and five-year time frames ending October 31, 2021, the MSCI ACWI fell to the very bottom of the peer group. In other words, practically all active managers have outperformed the index! Compare this to an S&P SPIVA analysis that indicates only 27% of U.S. large-cap equity managers beat the S&P 500 over the last five years.
Why is this true? Non-U.S. markets are generally less efficient, which we believe creates more significant opportunities for knowledgeable, experienced investors to exploit. Different languages, political regimes, macroeconomic influences, and degrees of economic development make it difficult to paint these markets with a broad brush. Consider power grids in India and Germany, for example. One country experiences frequent rolling brownouts, while the other generally has uninterrupted access to energy.
Q: Why now? What catalysts do you think could spark relative performance?
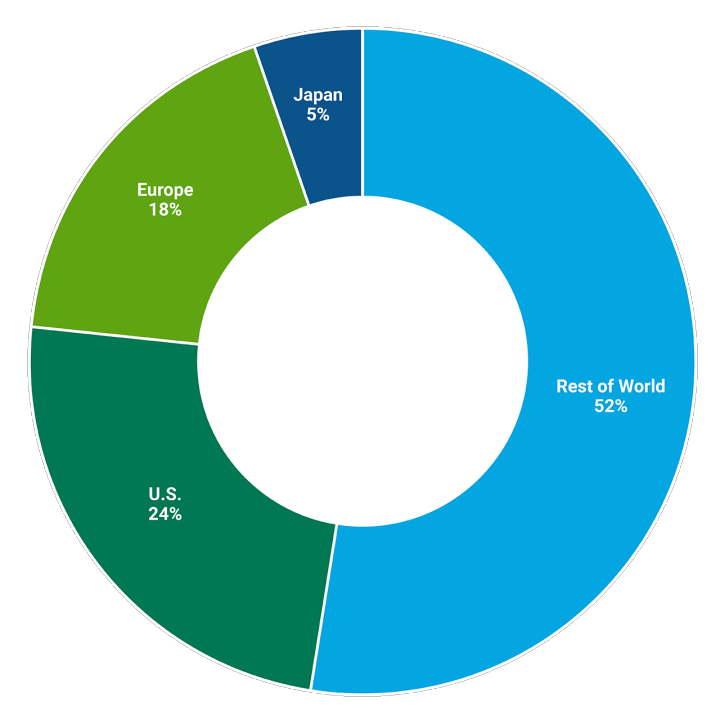
Gandhi: First and foremost is the benefit of diversification and the potential for longer-term growth. As shown in Figure 2, 75% of global GDP lies outside the U.S., but approximately 50% of the world market cap is non-U.S. That mismatch should equalize over time, in our view. Investors underexposed to international equities may lack exposure to some fast-growing areas.
Figure 2 | U.S. Dominates Global Market Cap, But Not Global GDP
Percent of World Market Capitalization
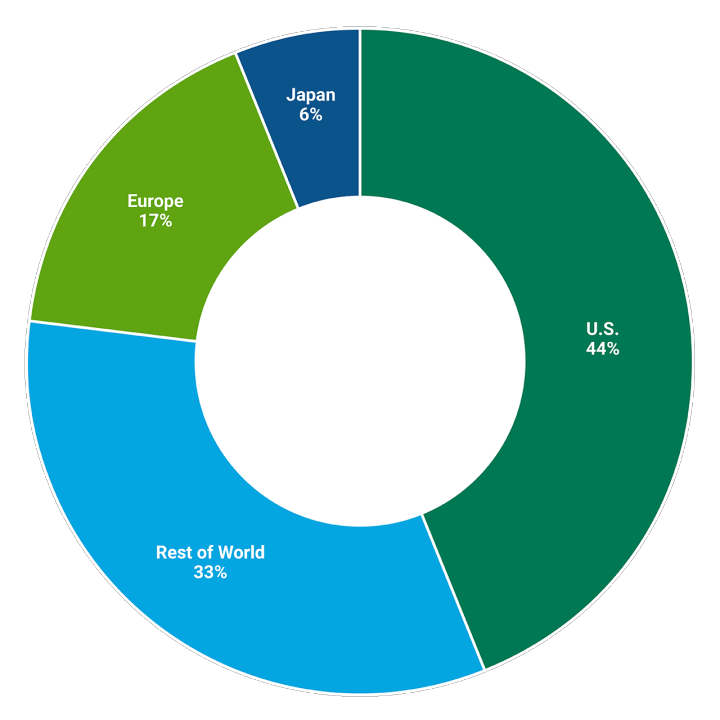
Percent of World GDP
YTD through 10/31/2021
Second, if you believe in mean reversion, non-U.S. markets may be poised to outperform. Our research shows that, since 1970, non-U.S. developed markets have outperformed the U.S. by 52%—roughly half the time. However, since 2007, the U.S. has outpaced non-U.S. markets during 11 of 14 years. To us, this suggests a trend that is ripe to revert to the mean.
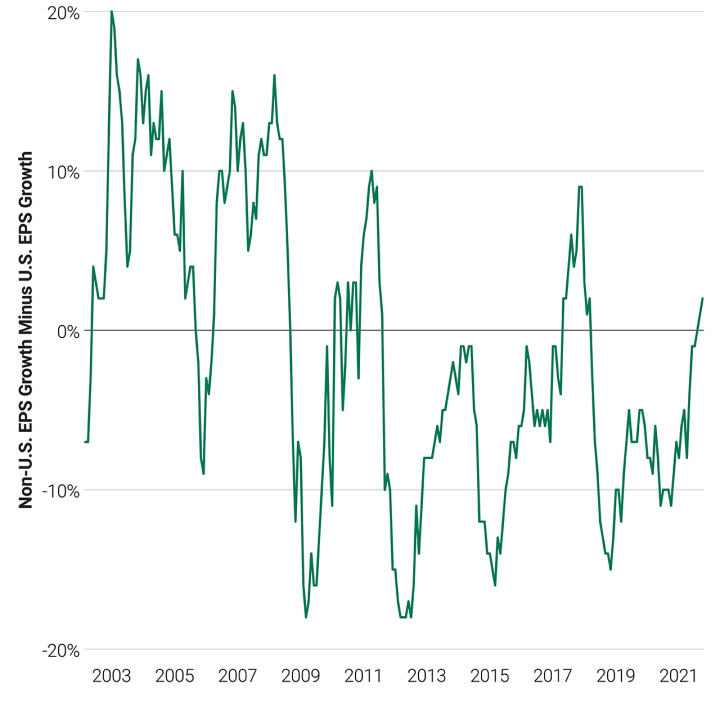
Fundamentally, there’s a strong catalyst for this outperformance to occur. Non-U.S. market P/Es are at a 20-year low relative to the U.S. At the same time, earnings growth is starting to outperform. See Figure 3. We think a combination of low relative valuations and greater and sustained relative earnings growth bodes well for non-U.S. markets.
Figure 3 | Relative Valuations and EPS Growth Make a Compelling Case for Non-U.S. Markets
Relative Valuations
MSCI EAFE vs. MSCI USA
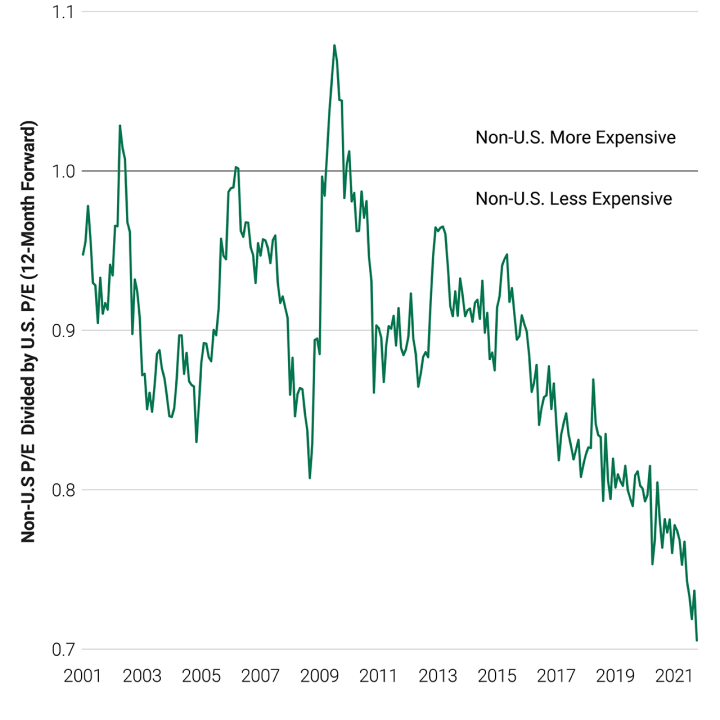
Relative EPS
MSCI EAFE vs. MSCI USA NTM EPS Growth
Q: After a strong EPS recovery in 2021, what’s your outlook for 2022 and 2023? Are rising input costs and supply chain issues dampening expectations?
Gandhi: Great question. First, let’s look at the market backdrop. In 2020, we shifted from a market driven by multiple expansion to one now driven by earnings growth, an environment better suited for our process. Year-over-year earnings growth moved firmly into positive territory in January 2021, and the market moved in line with that.
But that growth has stalled over the last few months, meaning earnings momentum has slowed. This results from everything we read in the headlines and what companies cite in their third-quarter earnings—component shortages, labor shortages, shipping delays, and higher energy costs. We hear inventory levels are low, and demand exceeds supply. We think these bottlenecks in shipping and supply chains are transitory and will unwind as supply improves. The recent earnings season suggested companies can pass through costs with demand remaining strong.
We expect earnings growth to reaccelerate in the first half of 2022. Non-U.S. earnings have made a full recovery and then some with 2021 EPS ending higher than their 2019 pre-pandemic peak. Once we get through these transitory friction points, we expect earnings growth to resume in the second half of 2022, with continued strength in 2023.
Three critical factors in this scenario include inventory replenishment after supply catches up to demand, consumers spending excess savings and a durable capital investment cycle.
Q: What opportunities are you seeing currently in non-U.S. companies?
Gandhi: There are many compelling stories right now. For example, Recruit Holdings in Japan is a human resource technology and media conglomerate. While its key business is the employment website Indeed, it also owns Glassdoor, the jobs site featuring employee reviews of employers.
The improving job market following pandemic-related lockdowns has accelerated growth for Indeed across Japan, the U.S. and Europe. Employers increasingly use Indeed to post job openings and identify candidates with specific educational and work skills.
We think Indeed has a long growth runway as it penetrates new end markets. Platform usage continues to grow as it disrupts the traditional brick-and-mortar model. Indeed’s addressable market is US$150 billion, which compares to the only US$3.7 billion in revenue generated last year.
Puma, the Germany-based branded shoe and apparel company, is another example. Puma has been consistently delivering 20%-plus top-line growth, higher than that generated by peers Nike and Adidas. The company has benefited from the shift in people wearing more athleisure products combined with new product innovations and category expansion.
Two years ago, for example, Puma entered the basketball category that Nike and Adidas dominate. It also recently reentered the performance running market with a new line of shoes. Recent sales growth has accelerated thanks to store reopenings and expansion of its online store. We believe the company has a long runway of growth given low market shares across its three main geographies.
Q: What are some examples of exciting growth companies that are domiciled outside the U.S.?
Gandhi: Our highest-conviction stocks we like are ones benefiting from a long-lived structural or secular inflection. We have various groups of stocks that group together into themes. One of them is a group of companies benefiting from investment in green energy and strategies to reduce carbon emissions.
Large, global leading companies benefiting from this investment cycle are more likely to be based in Europe than the U.S. Examples include Schneider Electric, Infineon Technologies and Iberdrola, all of which benefit from the shift toward renewable energy, such as wind generation and the growth in electric vehicles (EVs).
Infineon, for example, is a leading semiconductor company that makes specific chips to regulate the flow of electricity in an EV. Bureau Veritas is a test and inspection company that focuses on tracking carbon emissions.
Another theme that we like involves companies benefiting from the shift in the global manufacturing footprint. Production capacity is shifting out of China to lower-cost countries like Vietnam. In some cases, suppliers are moving closer to customers to reduce transportation costs and provide more just-in-time product flow.
Companies such as Keyence and Hexagon are beneficiaries of this capital investment as providers of sensors, cameras and measurement tools. Dassault Systemes is a crucial software provider supporting customers’ design and manufacturing processes.