Top five questions on yield curve inversion
The allure of money market yields was a key driver of asset class flows in 2023. With central bank policy entering next stage of the cycle, Alex Wise, Fixed Income Investment Specialist distils key questions clients have been asking this year. As central banks begin normalizing policy “free lunch” in money markets will shortly run its course and savvy diners should pivot to longer duration assets.
1. What has driven money market flows?
In the current cycle, central bank policy to tighten financial conditions with an emphasis on controlling inflation has driven the current yield curve inversion (i.e., short-term cash rates higher than those of longer maturity bonds). When looking at 1m T-bills versus 10 Year US treasury rates, the recent episode of inversion began in November 2022 as the US Fed hiked policy rates past 4%.
Undeniably, the rationale for moving into cash over the past couple years has been clear: risk aversion from longer duration assets susceptible to rising rates and more attractive yields on offer.
Why have money markets outpaced other asset classes in flows?
The combination of the highest yield levels for short-term risk-free rates since 2001 and an inverted yield curve have contributed to record inflows into money markets
Historical 3m US T-bill yields
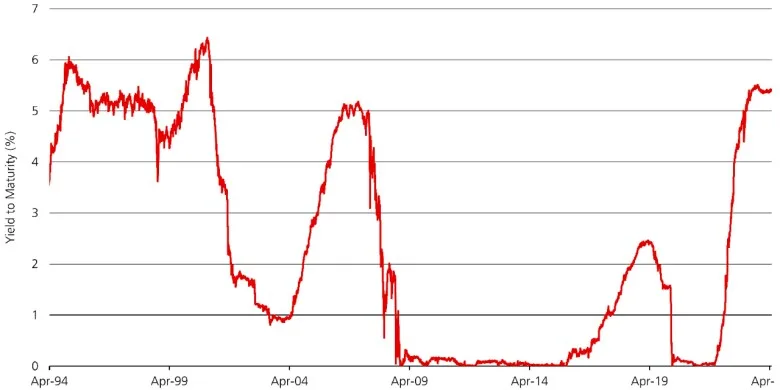
This chart shows the historical range of US T-bill yields (1994 to present). We can see there has been a sharp rise since early 2022 to present.
US Treasury yield curve
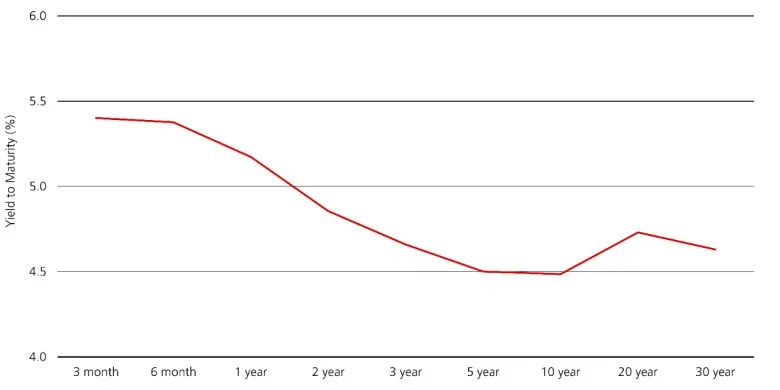
This chart shows yields to maturity levels across the US treasury curve with front end yields visibly higher than longer maturity (over 10 Year) points.
2. Is the yield curve trying to tell us something?
Yield curve inversions are renowned for being harbingers of recessions. Typically, investors push longer-term yields lower in expectation of rate cuts resulting from economic slowdown. Today, however, the picture is much more nuanced.
While hard recession is a possibility, (UK, Eurozone and New Zealand experienced technical recessions already) there is also a strong case for a soft landing where inflation falls to levels consistent with central bank targets allowing them to cut rates to “long-term neutral” levels. While the exact approach for calculating this level is highly debated, in the US it is estimated to be around 2.6% and in the Eurozone around 2%.
Economist Consensus Probability of Recession
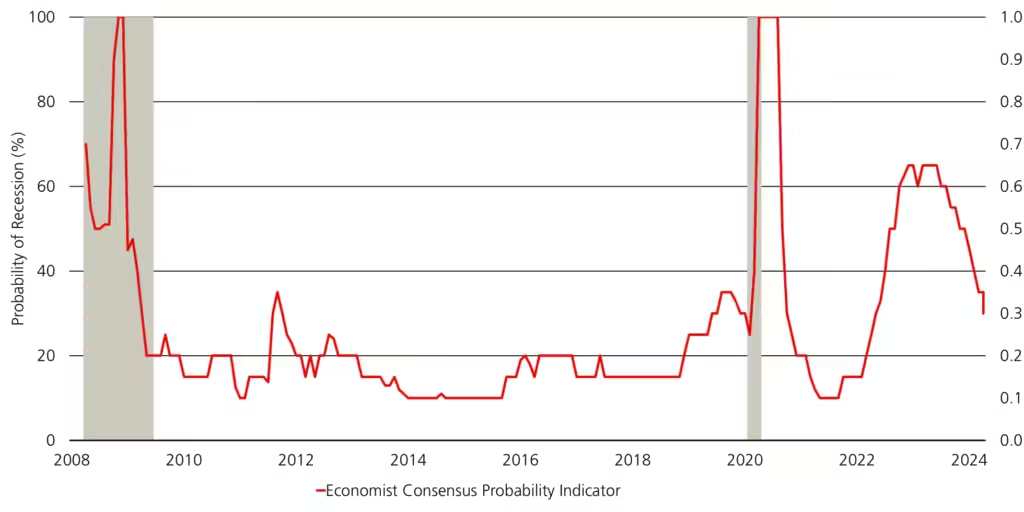
This chart shows Bloomberg economist survey of recession probability probability 2008 to present and how that probability declined since mid 2023
3. Status check – so where are we now?
Having peaked in 2022, headline inflation rates have fallen sharply to date. For example, Eurozone CPI currently stands at 2.4% year-on-year from a 10.6% high and in the US despite small uptick recently, CPI fell from 9.1% to 3.5% YoY. After sharply hiking policy rates since 2022, major central banks have been on hold for a significant period of time with the US Federal Reserve (Fed) delivering its final hike in July 2023 to 5.50%, the Bank of England (BoE) in August 2023 to 5.25%, and the European Central Bank (ECB) in September 2023 to 4.50%. Since then, focus has shifted to the timing and extent of rate cuts. Since December 2023, the US Fed indicated as many as 3 rate cuts (-75bps) in 2024 and further reaffirmed these in recent Fed Dot Plot with both the ECB and BoE expected to also make cuts in the coming months.
Fed Funds dot projections
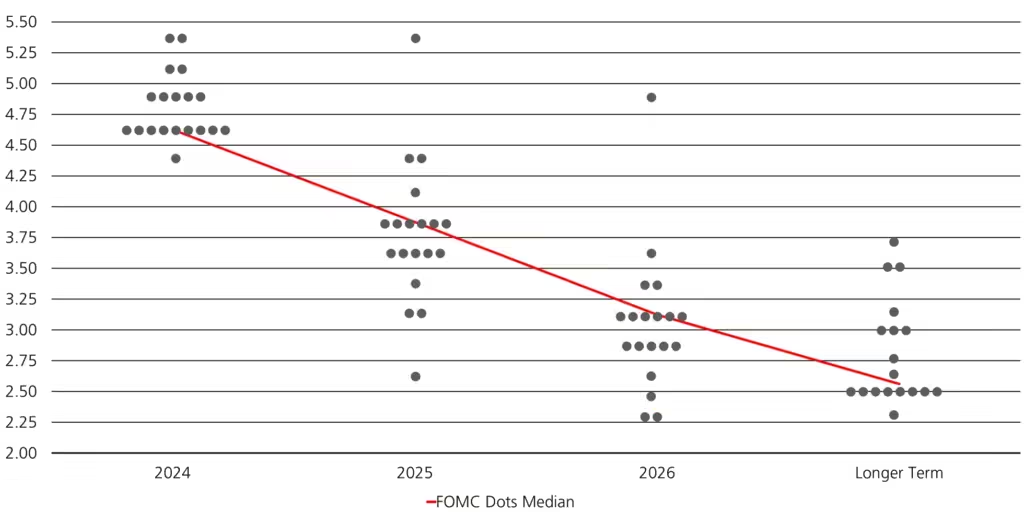
This chart shows the distribution of FOMC members projections for Fed Funds rate expectations over the period of 2024, 2025, 2026 and long term.
4. What does this mean for yield curve inversion?
The exact timing of yield curves normalizing to an upward slope is uncertain and driven by a combination of factors including the pace of inflation softening and the timing and magnitude of policy rate cuts. Historically, such as in 2001, major steepening was driven by sharp and deep recessions due to collapsing demand rather than falling inflation causing central banks to cut rates. In absence of collapsing demand, we are the closest we have been to upward sloping curves in the current cycle with the ECB expected to start cutting policy rates in June, the BoE in August and the US Fed in September. These are of course market expectations grounded in policy maker commentary and macro-economic data with sharp and sustained inflation uptick being the key risk. Regardless of the exact timing, it is likely attractive cash rates will lose their lustre in the near future.
Implied rates ‘x’ months from now, in percentage(%)
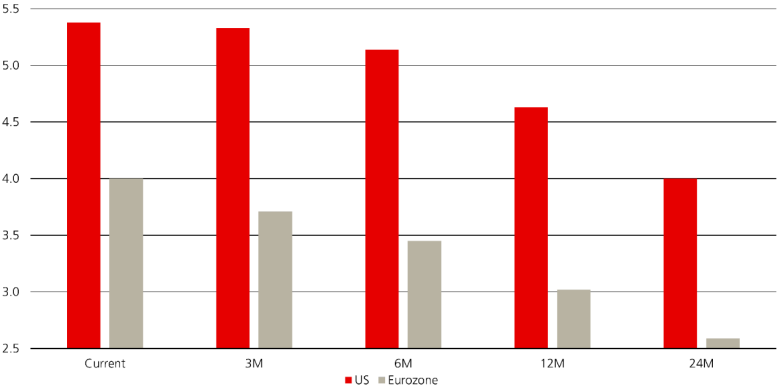
This chart displays implied policy rates across a 3,6-,12- and 24-month period from now in both the US (red) and Eurozone (grey).
Historical 3m US T-Bill Change During Rate Cut Cycles
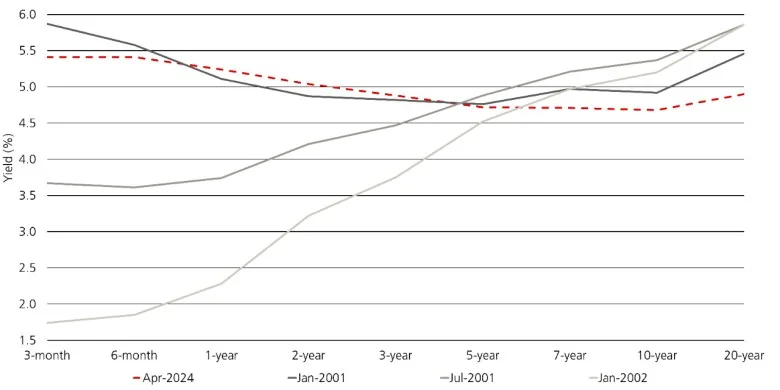
The chart shows 3 US Treasury curves three, six and twelve months after the first rate cut.
Change in 3m US T-Bill Yield Following First Rate Cut
First Rate Cut | First Rate Cut | 3 months | 3 months | 6 months | 6 months | 1 year | 1 year |
|---|---|---|---|---|---|---|---|
First Rate Cut | Jan 2001 | 3 months | -178bps | 6 months | -225bps | 1 year | -419bps |
First Rate Cut | Sep 2007 | 3 months | -105bps | 6 months | -309bps | 1 year | -404bps |
First Rate Cut | December 2018 | 3 months | -49bps | 6 months | -51bps | 1 year | -197bps |
5. How should investors position, or is it too early?
Risk-reward has already shifted towards longer duration assets. While cash investors may be feeling comfortable with 5.10% return on 0-3 month T-bills in 2023, long duration broad fixed income as characterised by the Bloomberg Global Aggregate USD hedged index delivered an even more attractive return of 7.15%. Even more important is the majority of that return came during the last quarter as various central banks paused and pivoted to signalling rate cuts. The exceptional returns over that period were driven by capital gains as bond yields fell. This underlies the fact that in addition to attractive yields last seen in over a decade, this entry point also provides an exceptional opportunity for capital gains if bond yields fall.
More recent economic data weakness has further affirmed the view that major central banks including the ECB and the Fed appear likely to begin cutting rates in 2024 and possibly as soon as June. This illustrates that at this stage of the cycle timing the market can be risky as volatility remains elevated, but the opportunity cost of not considering longer duration fixed income assets is high when the cycle turns.
For investors concerned about having missed the interest rate rally in Q4 2023, developments in the beginning of 2024 have given back some of the gains presenting a more attractive entry point for those considering adding duration. This provides investors a unique opportunity and a second chance to jump on board as the monetary policy cycle turns.
Despite T-Bills having the highest yield, 10 and 30-year US Treasuries have longer durations and therefore total returns would be higher if rates decline
What is the opportunity cost by remaining in T-Bills? If rates decline as the market and Fed projects, duration drives total returns through capital gains
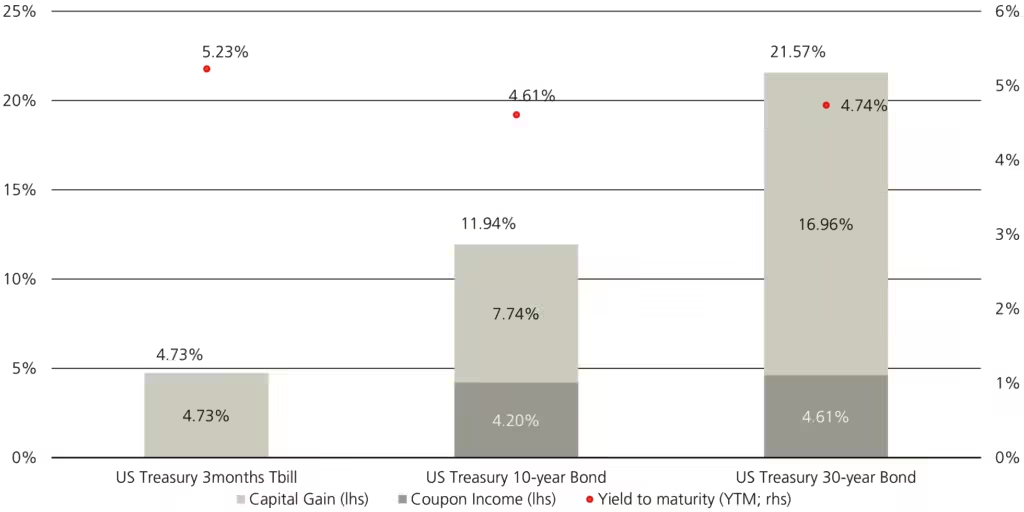
Compares T-Bills yields and total returns against 10- and 30-year Bonds over a 12-month period if yields decline by 100 basis points
Yields tend to decline after Fed stops raising rates 10-year US Treasury yield historically has declined sharply following Fed rate hiking cycles.
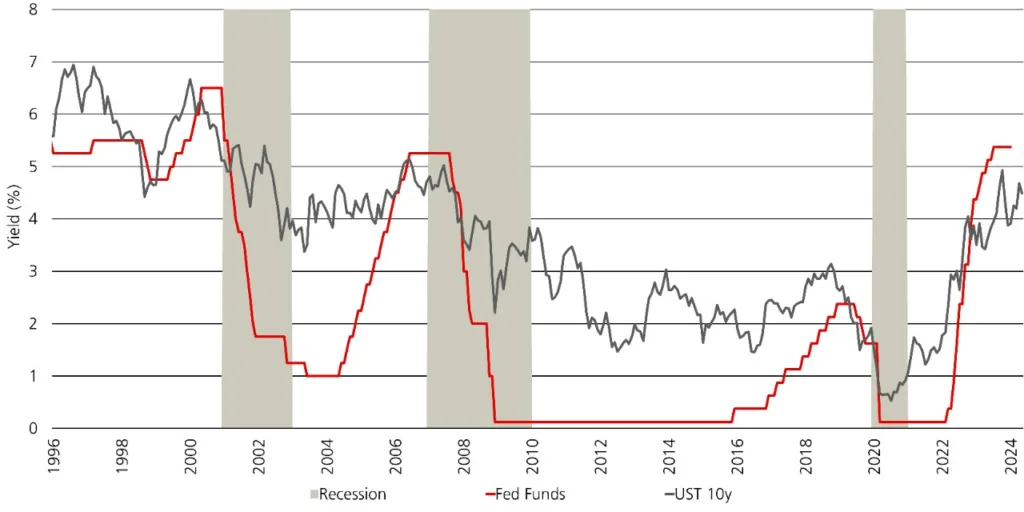
10-year US Treasury yield historically has declined sharply following Fed rate hiking cycles.
Capture multi year high yield levels
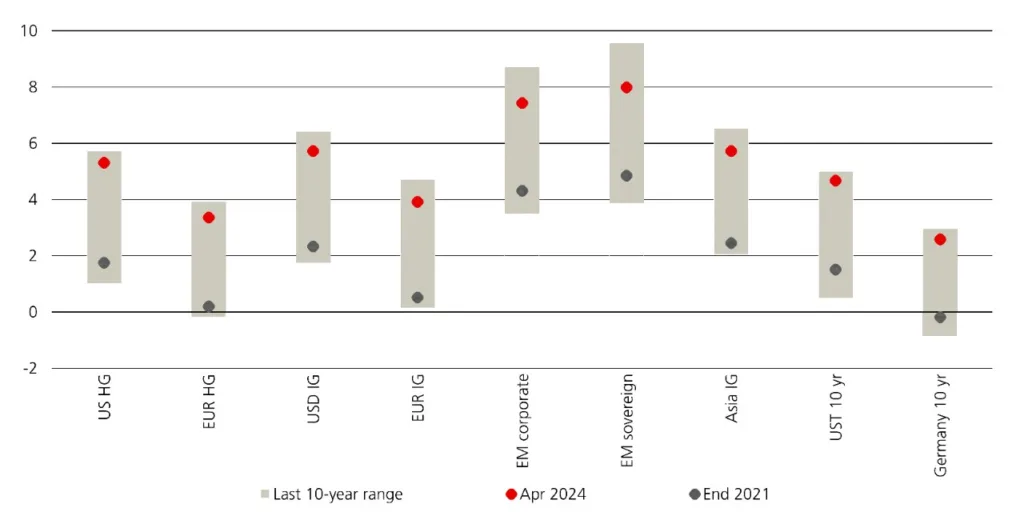
Yield to worst, %. Last 10-year range (grey column), current and end-2021
For illustative purpose only past performance is no guarantee of future results Assumption is a 100bps continuous parallel interest rate shift downwards across the entire curve and reinvestment of the realized total return every quarter for 3 months cash. Calculation model: FIH function on Bloomberg . Coupon income refers to the actual coupon received based on the existing 10/30 year bond. This illustration do not take into account any other factors. Historical performance and forecast are no guarantee for future performance.

