
Statistical analysis of currency performance groupings reveals some surprising geographical outliers and an increase in mobility between different groups.
Dendrograms won’t come as anything new to regular readers here after my colleague Patrick Greene introduced them in his blog.
Patrick analyses historical returns to better understand the statistical resemblance of certain equity sectors and regions to one another. It’s worth reading his blog before this one, not least because he explains how to read the charts produced in the following analysis!
In this blog, we apply the same analysis, but to currencies.
The long and the short of it
Similarly to before, we will look at both long- and short-term examples in order to understand the general dynamics that have driven currencies over the longer term, and to identify where these similarities have changed more recently.
For a longer-term view, we constructed the below dendrogram using weekly data from the turn of the century:
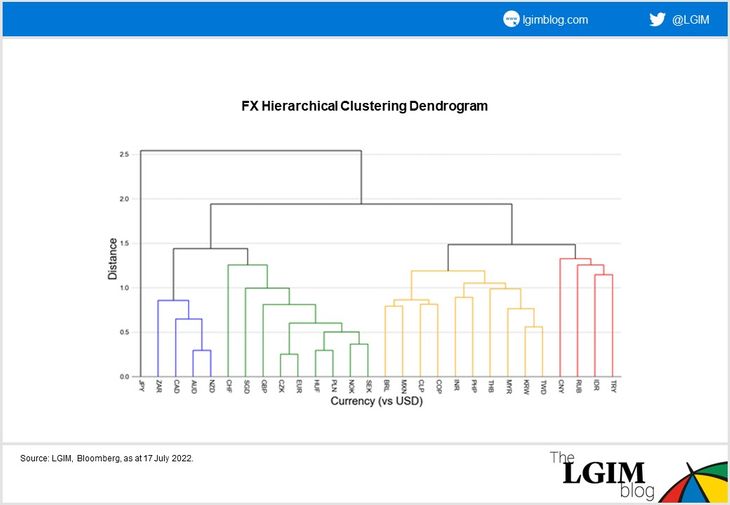
As a reminder, the coloured groups represent those currencies that are most similar, while the branches connecting currencies indicate the degree of similarity: the lower the branch, the more alike the currencies are. Over the long term, we see some distinct groups: a commodity-linked group of mostly developed countries (blue), a European currency bloc (green), an emerging market (EM) currency bloc (yellow) and an additional bloc of ‘special’ emerging currencies (red). The Japanese yen lives on its own, similar to little else.
Our results generate groups that are largely geographically-based; after all, countries in geographical proximity are often key trading partners, and share somewhat similar natural resource reserves. These similarities often lead certain currencies to behave similarly to one another, given that their underlying economies have similar exposure to general macro and market conditions.
Outliers
There are several noteworthy surprises, however:
- The South African rand is more closely related to developed commodity currencies than other EM currencies
- The Singapore dollar acts in such a developed manner that it’s more akin to the European currency bloc
- The Asian and Latin American currencies are driven as much by general EM factors as they are by more regionally specific factors
- The existence of the ‘special’ group of emerging currencies, marked in red
Looking at the past year alone, the story looks different.
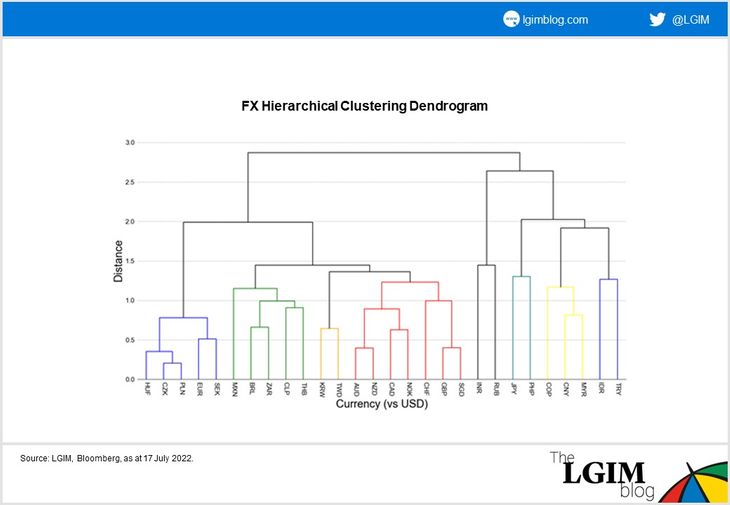
At first glance this dendrogram looks more colourful, as if there are fewer similarities over the last year. Some similarities do remain, but there looks to be more of a commodity angle at play (i.e. commodity importer versus exporter, and exposure to the various commodity sectors: metals, energy and food).
Central and Eastern European currencies remain similar to the euro and Swedish krona (blue), but the Norwegian krone has joined the other developed commodity currencies, in a group alongside the pound sterling, the Singapore dollar and the Swiss franc (red). The blue group now contains the European currencies most exposed to the Ukraine conflict, while the red group contains developed currencies that are more shielded from the conflict (for example, Norway is a commodity exporter, and the Swiss franc is known to be a safe-haven currency).
The Latin American countries are commodity exporters (green), with their currencies benefitting from strong commodity export prices, but Colombia, as the largest oil exporter, has moved out (yellow).
Within Asia we see that South Korea and Taiwan, both on the verge of being developed nations and geared toward the global manufacturing cycle, have distanced themselves from the rest of the Asian currencies. For the rest, we have less-defined groupings and more one-to-one similarities, which suggests several drivers all playing out at once in markets, when we put aside the key theme of US dollar dominance.
How we put the theory into practice
Ordinarily we look for opportunities within similar groups as these tend to provide better diversification for our portfolios. As currencies have increasingly been travelling between groups we can’t rely on the groupings as much anymore. This acts as a sign for us to be more careful when taking on currency trades, and is why at the moment we have taken on less risk (fewer, small trades) than we normally would.