
When you think about cloud computing companies this year, the most likely starting point will be performance1:
- The BVP Nasdaq Emerging Cloud Index, from its high last November to its near-term low in June, fell 60.20%.
- This compares to the S&P 500 and Nasdaq 100 Indices, down 21.21% and 31.17% respectively, over the same period2.
However, from June 16th to August 22nd this year3:
- The BVP Nasdaq Emerging Cloud Index returned 17.56%.
- The S&P 500 and Nasdaq 100 Indices returned 13.07% and 15.97% respectively, over the same period4.
The bottom line: The dominant force explaining the performance of cloud computing companies has been macroeconomic, meaning that as the US Federal Reserve (Fed) and other central banks pursue more restrictive monetary policies to fight inflation, the valuations of cloud companies have fallen. Similarly, if investors ‘feel’ that inflation is easing in any way—and subsequently central banks may slow the pace of tightening—there has tended to be a strong positive share price response.
The BVP Nasdaq Emerging Cloud Index: August 2022 rebalance
We mention the BVP Nasdaq Emerging Cloud Index as a measure of the performance of cloud companies because it is designed to offer a precise exposure to their growing revenues by serving enterprise customers. What we see in Figure 15:
- The blue line, sloping upward from left to right represents the weight (vertical axis) and the six-month performance (horizonal axis) of initial constituent companies before the August 2022 rebalance. Companies like RingCentral, Asana and Blend Labs faced performance challenges over this period, whereas companies like Paylocity Holding Corp, Box and Qualys tended to see stronger performance.
- The grey line shows that the rebalance resets the Index to equal weight. Companies that outperformed see their weights decrease, and companies that underperformed see their weights increased. This leads to a valuation sensibility and risk mitigation every 6-months.
- Red dots and company labels indicate companies that will no longer be constituents after the August 2022 rebalance. The primary reason, historically, why companies are deleted is that there is an announced deal, such as an acquisition by a private equity firm.
- Green dots and company labels indicate companies that are new constituents and will be added to the index after the August 2022 rebalance. The primary reason companies are added is that they have become accessible in public equity markets.
Figure 1: Bringing the BVP Nasdaq Emerging Cloud Index back to Equal-Weight
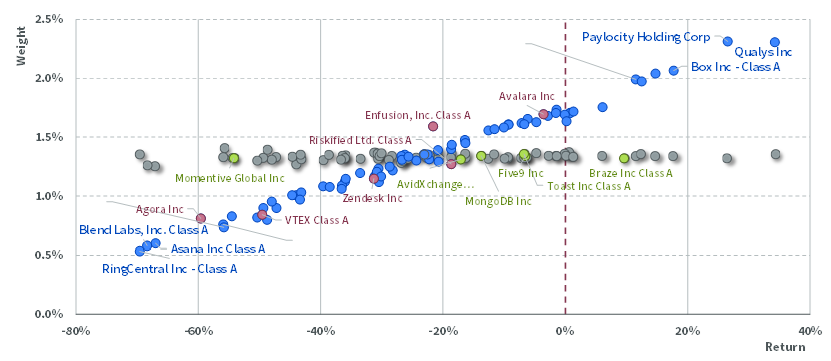
Sources: WisdomTree, Bloomberg, Nasdaq. Company returns presented on total return basis for the period from the previous rebalance on 22 February 2022 to 22 August 2022. Companies are constituents of the BVP Nasdaq Emerging Cloud Index. Grey markers represent index constituents as of 22 August 2022 (post-rebalance); blue markers – as of 19 August 2022 (pre-rebalance). Lime markers represent index constituents added and crimson markers index constituents removed after the rebalance. You cannot invest directly in an index. Historical performance is not an indication of future performance and any investments may go down in value.
The fundamentals will matter again
It would be difficult for us to argue that the main catalyst for the share price performance of cloud companies has to do with fundamentals like revenue growth. As we noted earlier, the main catalyst has been the macroeconomic backdrop.
However, company fundamentals are always an important force and will always come back to prominence once macro pressures fade. What we see in Figure 26:
- Along the horizontal axis, almost every blue dot is to the right of the 0% boundary, indicating positive year-over-year revenue growth, as per the most recently announced quarterly results. It may be a tough economic environment, but by and large these companies continue to grow revenues.
- Along the vertical axis, higher on the chart means higher valuation. Some companies, like Gitlab, Snowflake and SentinelOne are still trading in the range of 25-30.0x Enterprise Value to Sales ratio (EV/Sales). While this may not be ‘inexpensive’, these companies have been growing revenues in the range of 50-100%, year-over-year. If that can be kept up, maybe that premium multiple is warranted. We would note that the majority of the 75 blue dots are below the 10.0x line, however.
- The weighted average sales growth for the BVP Nasdaq Emerging Cloud Index is still in the range of 35-40%, where it has been positioned consistency for some time. Is this sustainable? Microsoft Azure, Amazon Web Services and Google Cloud tend to see their, admittedly, very large revenue bases growing year-over-year in this range. The fact that the biggest players seem to, for the moment, be sustaining these rates of growth, tells us that the smaller companies—like those in this index—may be able to sustain growth rates higher than one might see in other sectors.
Figure 2: Gauging the fundamentals
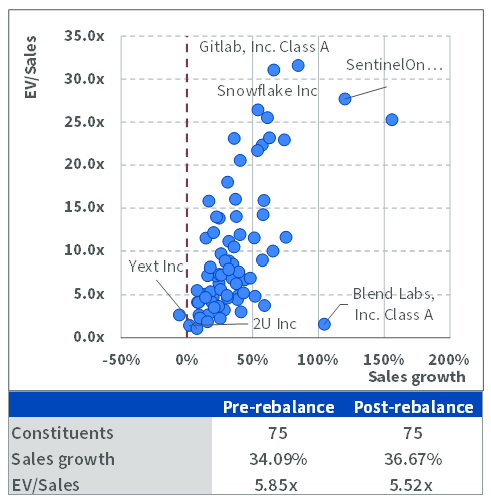
Source: WisdomTree, Bloomberg, Nasdaq. As of 22 August 2022. All fundamentals data is from Bloomberg. Sales growth for the underlying constituents is computed year-over-year from either quarterly, semi-annual or annual data, based on whichever is available in Bloomberg starting from quarterly data. EV/Sales is represented by a ratio of Enterprise Value over trailing twelve-month Sales. Index sales growth is represented by a weighted average sales growth of the index constituents. Index EV/Sales is represented by a weighted harmonic mean of the EV/Sales for the index constituents. You cannot invest directly in an index. Historical performance is not an indication of future performance and any investments may go down in value.
Conclusion: Cloud Companies will continue to deliver exciting results
In cloud computing, it’s important to look at all the available signals such that one can gain the most appropriate sense of market conditions.
Bessemer Venture Partners has just put out its annual Cloud 100 Benchmarks report for 20227. This report specifically looked at the largest and most dynamic private cloud companies, which provide important signals for the overall health of the business model.
In 2022, Bessemer specifically notes that the valuation of private companies may not be the best metric to look at if the goal is to get a sense of the ‘health’ of a given market. For instance, if companies have not raised money recently, they may not have their valuations marked all the way to present market conditions. Bessemer instead focuses on what they call ‘Centaurs.’ While being a ‘Unicorn’ is $1 billion in private market valuation, a Centaur is 100 million in annual recurring revenue.
For the 2022 Cloud 100, 70% are already achieving Centaur status and a further 10% more are quite close and could reasonably do it before the year is out. In an environment where the market is focusing much more on results than exciting stories and private funding is harder to come by, proving business success at the Centaur level is indeed important.
1 Source: Bloomberg, with data from 9 November 2021 to 16 June 2022
2 Refers to the S&P 500 and Nasdaq 100 ‘net total return’ indices
3 Source: Bloomberg, with data from 16 June 2022 to 22 August 2022
4 Refers to the S&P 500 and Nasdaq 100 ‘net total return’ indices
5 Source: The 6-month period between rebalances is from 22 February 2022 to 22 August 2022. The performance source is Bloomberg
6 Sources: WisdomTree, Nasdaq and Bloomberg, with data measured as of 22 August 2022. Further details in sourcing are below Figure 2
7 Source: https://www.bvp.com/atlas/the-cloud-100-benchmarks-report/?from=feature