Covid-19 index: when might life return to ‘normal’? – April 2021

Covid-19
As one of the world’s largest economies the US is a key focus for investors. With every country attempting to return to normality following the coronavirus pandemic, we are monitoring when US economic activity might get back on track, as well as other measures of “normality” such as entertainment and leisure, high street shopping, and schools reopening. The result is an index that measures progress toward a post-pandemic world.

Our Return to Normal index

With the US Covid-19 vaccination program well underway, the Return to Normal Index measures human activity data relative to pre-pandemic levels. The index is constructed by our data scientists and fundamental analysts and tracks activities in the US, including travel, returning to work and school, brick-and-mortar shopping and eating out. By design, the index is focused on measuring components of daily life rather than economic indicators such as GDP growth. The percentage level will move closer to 100 as daily life normalises, and our analysts will update it on a regular basis.

What has changed?

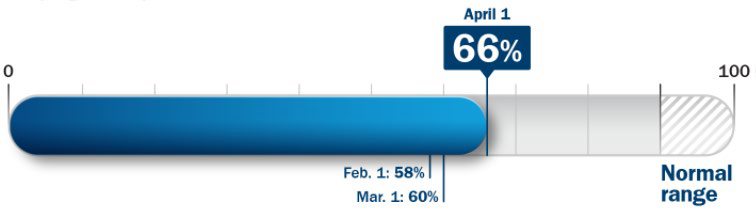
Since our March 2021 update, the Return to Normal Index has climbed to 66% – all of the index components that we track are improving. Drivers of this increase include a broader pool of people receiving vaccines and looser

restrictions on many activities. The monthly jump has made it clear that widespread vaccination can fuel behavioural and economic recovery. By May 2021, two more vaccines will probably be approved in the US, enabling supply to meet demand by the end of the second quarter.

We are at an important inflection point for the return to normal, as we continue to watch data indicating that infection rates have plateaued – or started to increase – in some locations. We are also watching the data on variants that have significantly spread throughout the US. If we see a large spike in cases, the momentum carrying the country to our normal range could slow. Among the index components, return to in-person schooling saw the greatest monthly gain as more counties moved away from remote learning and back to in-person or hybrid models.
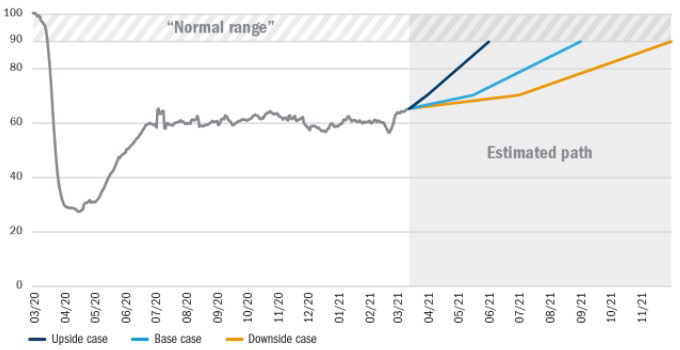
Activity numbers won’t all return to where they were before Covid. The index could hit “normal” at a point lower than the 100 level due to continued changes in behaviour, like working from home and reduced business travel. The definition of the future normal is evolving, and the index’s normal threshold will reflect our data science and fundamental research insights.

Figure 1: The Return to Normal Index tracks activity compared with pre-pandemic levels as we progress to post-Covid life

What are we monitoring, and where is it at?

We are analysing the time people spend engaging in a broad set of activities outside their homes (Figure 2). The index components have implications for economic growth, but the primary objective is to monitor how close or far we are to returning to normal life.

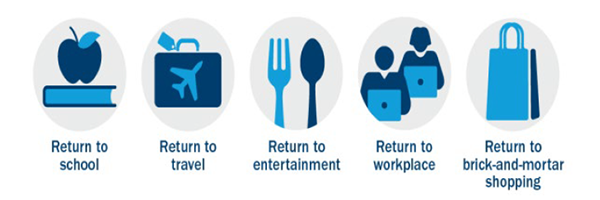
Figure 2: Tracking inputs

Our index suggests we are still 34% below pre-Covid activity levels. The levels of component activity vary: the return to brick-and-mortar stores is 24% below its pre-Covid level and a normal work routine is 25% below. The subcomponent with the lowest level is travel/entertainment: 52% below pre-Covid levels.

What could drive change?

Faster vaccine distribution and uptake could accelerate the path to normal (ie, the upside case). Developments that could impede a return to normal (ie, the downside case) include the emergence of variants that are resistant to current vaccines or slower uptake of the vaccine in certain places (because of people’s unwillingness to get vaccinated or shortfalls in supply).

Figure 3: The Return to Normal Index over time – level as of 1 April: 66%

This index provides a framework as we analyse companies. It is a roadmap for what normal activity might look like after Covid and how long it will take to get there. The information allows us to test a company’s own assumptions and make adjustments in our views as needed. For investors, the Columbia Threadneedle Return to Normal Index can act the same way: it’s an additional input to consider as they research their individual asset allocation and portfolio decisions. Understanding where we are on the path to normal life will be a critical question in 2021. This data can help inform investors’ asset allocation decisions and set expectations on market activity.

Leave a Reply

Your email address will not be published. Required fields are marked *