
Key Takeaways
- Broad commodities are a great portfolio diversifier and have proven to be an excellent inflation hedge in recent years1.
- The WisdomTree Enhanced Commodity UCITS ETF (WCOA) offers an optimised roll strategy.
- This strategy has the distinct advantages of having better long-term returns, lower volatility, lower drawdown risk, and a better ability to deal with shock events than simple front-month following strategies like the Bloomberg Commodity Index.
- Related ProductsWisdomTree Enhanced Commodity UCITS ETF – USD AccFind out more
Broad commodities are a great portfolio diversifier and have proven to be an excellent inflation hedge in recent years2. How you implement a commodity investment can make a big difference in terms of performance, risk characteristics and ability to deal with shock events. In this blog, we compare an optimised commodity strategy with a standard commodity benchmark and find that for long-term investors, the optimised strategy is superior in many dimensions.
The Bloomberg Commodity Index (BCOM) is seen as the benchmark commodity index in Europe, tracking a wide variety of commodities where commodity selection and weights are driven by the liquidity of underlying futures. BCOM focuses on the most liquid segment of the futures curves – around the font-end of the curve. However, investing in the first or second contract can be quite expensive, depending on the shape of the futures curve. Notably, when the curve is in contango (which has historically been the “normal” shape of futures curves), the so-called cost of carry can be a drag on performance. Very often commodity futures curves in contango are concave and so the implied cost of carry tends to be higher towards the front of the curve.
EBCI: Outperforms by optimising contract selection
The WisdomTree Enhanced Commodity UCITS ETF (WCOA), which tracks the performance of the Optimized Roll Commodity Total Return Index (EBCIWTT), uses the same starting weights as BCOM, but optimises performance by selecting the contract with the highest roll yield (or, conversely, the lowest cost of carry). Figure 1 illustrates how this methodology has historically influenced performance.
Figure 1: EBCIWTT and BCOM performance compared (index = 100 on 15/05/2001)
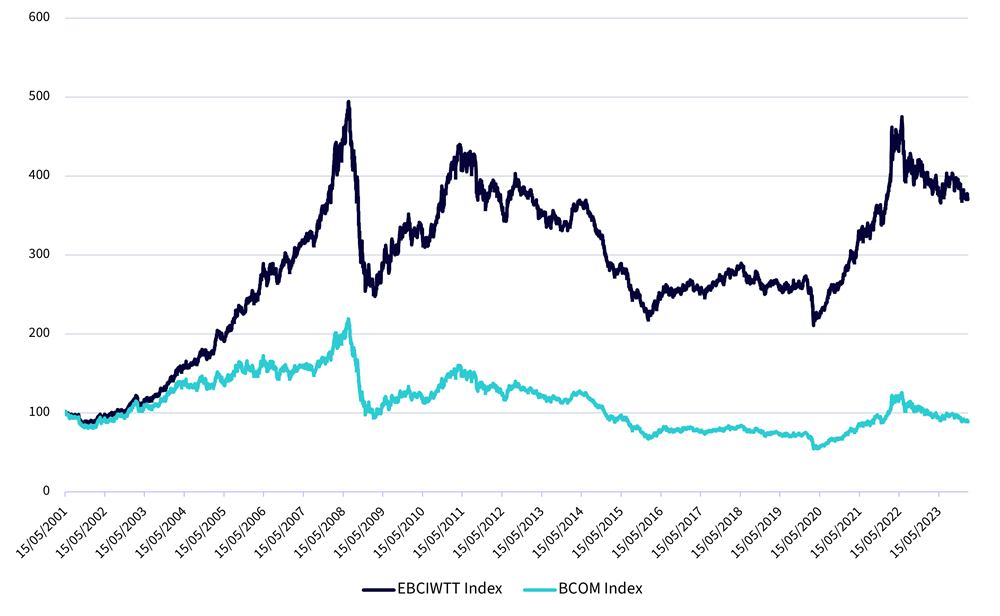
Source: Bloomberg. Historical performance is not an indication of future results and any investments may go down in value.
With a lower risk profile
Next, let’s delve into the risk profile of this strategy. We’ll explore whether the pursuit of better performance comes at the expense of increased risk. Specifically, we’ll examine the three-year rolling volatility and the three-year rolling maximum drawdown.
Figure 2 illustrates that the strategy had between 3.5% and 1.5% less volatility compared to BCOM (see the shaded area measured on the right axis), with an average of roughly 2.5% lower volatility since inception.
Figure 2: Three-year rolling volatility
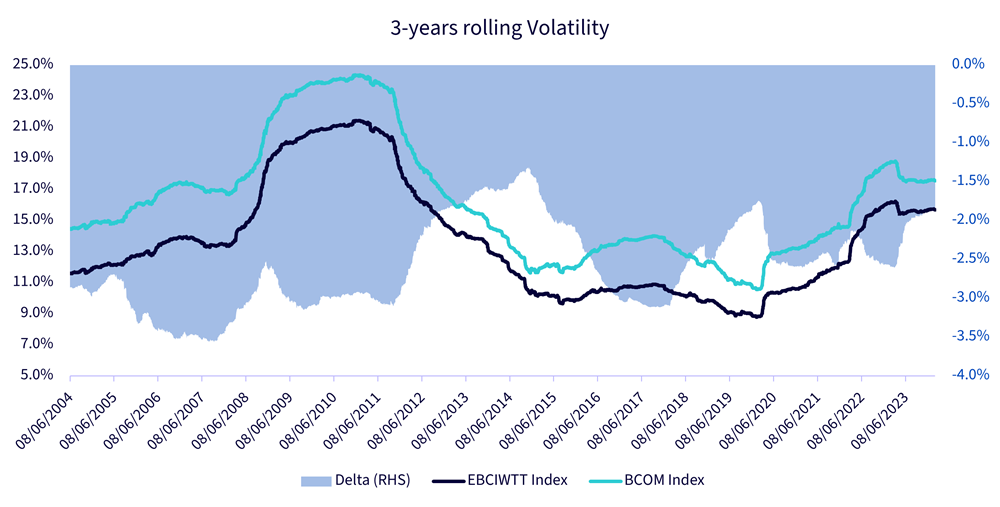
Source: Bloomberg, WisdomTree. Historical performance is not an indication of future results and any investments may go down in value.
Figure 3 shows the three-year rolling maximum drawdown for EBCI has been better than BCOM at almost every point since inception. The difference in the drawdowns were as wide as 7% during the COVID pandemic, highlighting the optimised strategy’s ability to deal with the shock events in a more robust fashion.
Figure 3: Three-year rolling maximum drawdown
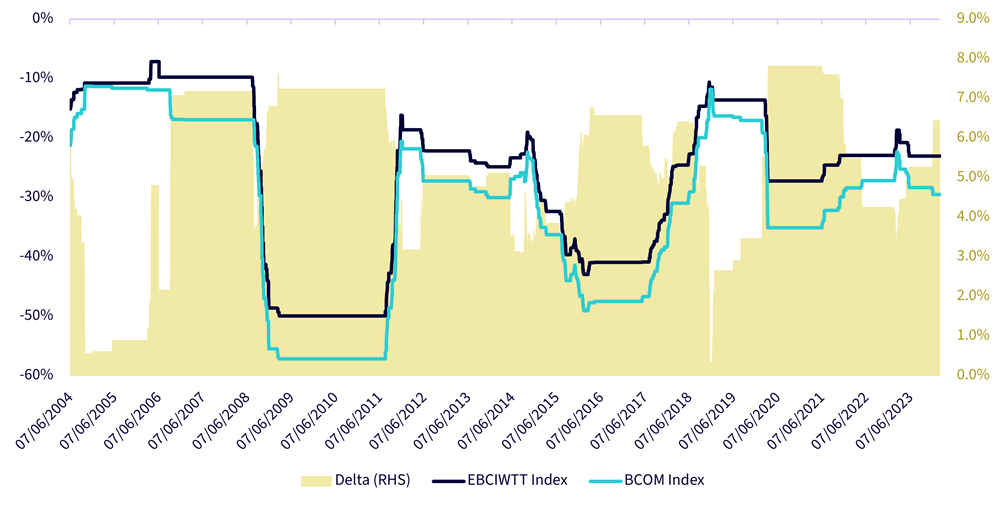
Source: Bloomberg, WisdomTree. Historical performance is not an indication of future results and any investments may go down in value.
WCOA’s contract selection methodology
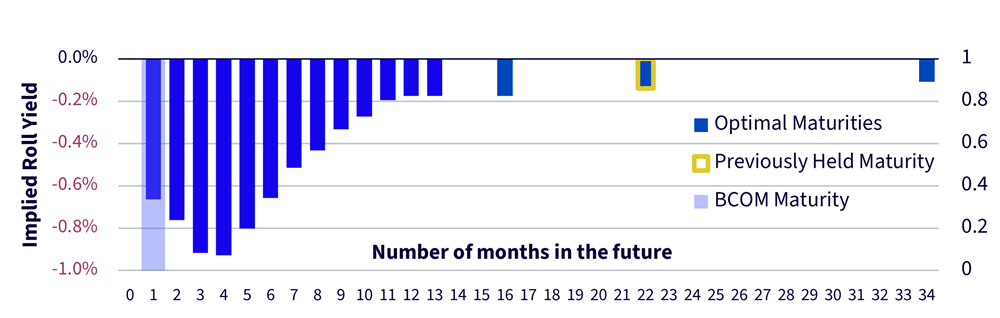
Let’s dig a bit deeper on how EBCI achieves this by selecting the contract with the highest roll yield. As we said, the strategy usually selects the contract maturity with the highest implied roll yield. Let’s consider a hypothetical futures curve (see Figure 4). BCOM would normally select close to the front of the curve, like the light purple shaded area indicates. But EBCIWTT has a set of contracts it can choose from, which are marked by big, light blue dots. Contracts eligibility depends entirely on some stringent liquidity requirements, and that’s what makes EBCIWTT an interesting product from a liquidity profile.
Figure 4: Illustrative contract selection example
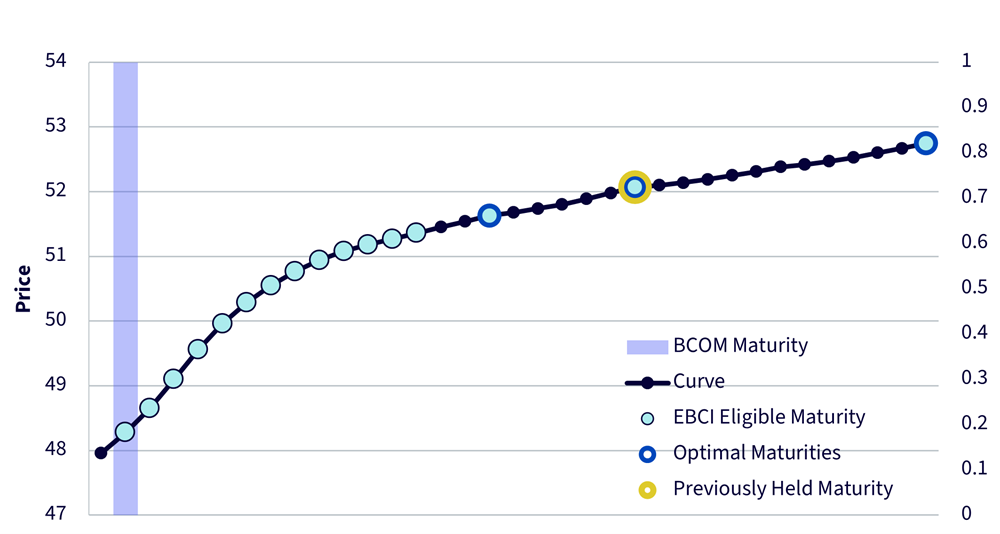
Source: WisdomTree. Historical performance is not an indication of future results and any investments may go down in value.
In order to pick one of those contracts, the strategy looks at the implied roll yield at the bottom of the chart. The implied roll yield is defined as the expected performance to be generated by being invested in a given contract, assuming that the curve does not change shape. In this example, the contract with the highest roll yield is the farthest one. For some contracts though, in order to limit turnover, the strategy switches maturity only if the one it holds is not amongst the best n implied roll yields (n is the ‘rank order’, and we set it to three in this example). In this case, the previously held maturity is in the optimal set, and so we remain invested in this one, even if its implied roll yield ranks second. If the strategy was to be invested in a contract closer to the front month, it would have switched to the contract 34 months far down the curve.
The strategy applies the same methodology for all the commodities within the BCOM index3. However, the optimal set is different for each commodity, with some commodities only having a ‘set’ of one, i.e. if there is an eligible contract on the curve with a better implied roll yield it will move to that contract on monthly rebalance.
A concrete example: Crude oil during the COVID pandemic
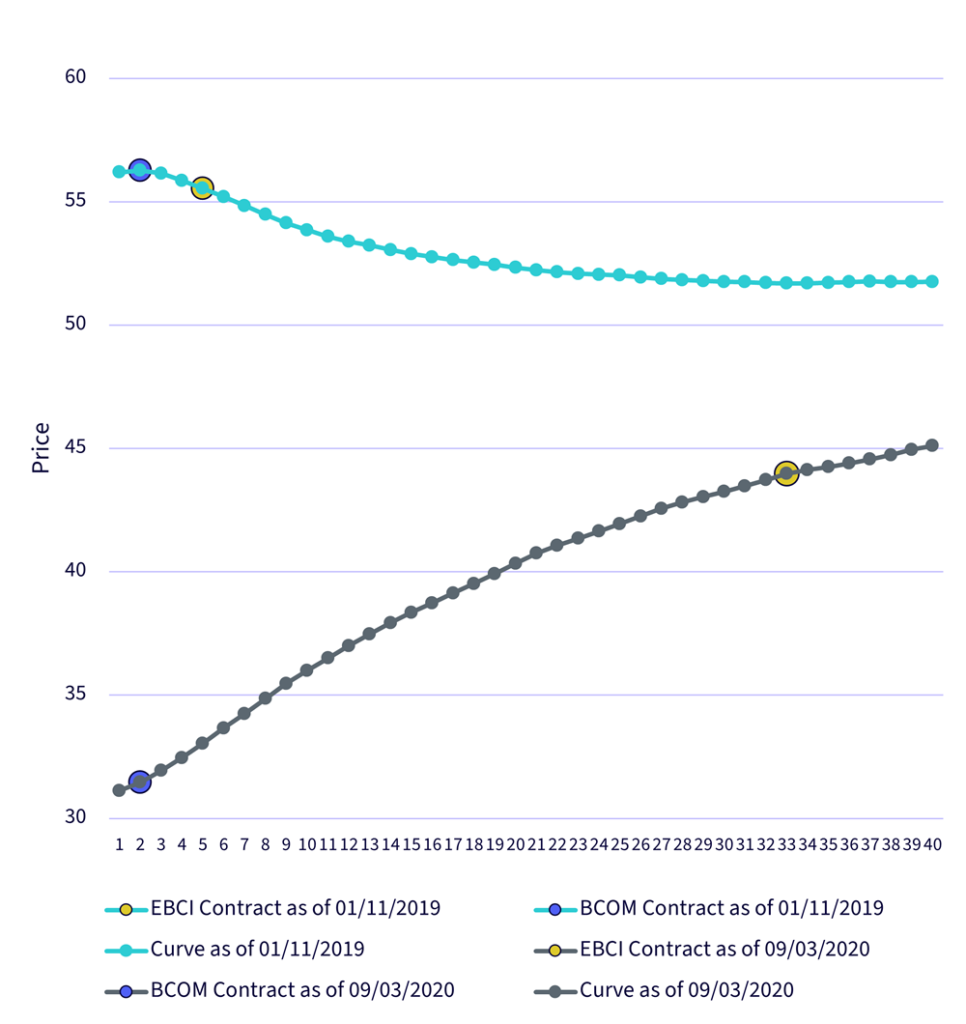
We illustrated above a fictious example of how the contract selection works, but now we will see a real example to highlight how effective it has been in practice. We take WTI Oil as an example (see Figure 5), and we will analyse the period around the COVID pandemic. Before the COVID outburst, at the beginning of November 2019, the WTI Oil curve was in a slight backwardation, and Optimised Roll Commodity Total Return Index (EBCIWTT) was close to the front month of the curve (namely, in the fifth contract on the curve). The pandemic broke out and the expectations for the global economy plummeted, dragging down oil prices. On the 9 March 2020, the day when EBCI started rolling the oil contract, the curve was in a deep contango (see gray line in Figure 2). The strategy then moved to the contract expiring in December 2022, more than two years out. On the other hand, BCOM stayed tied to the front part of the curve. Subsequently, the spot price continued to plunge, and with it all the front of the curve, while the back end remained better anchored. A few weeks after this price plunge, spot prices rebounded while the curve remained in contango.
Figure 5: WTI future curves
Source: Bloomberg, WisdomTree. Historical performance is not an indication of future results and any investments may go down in value.
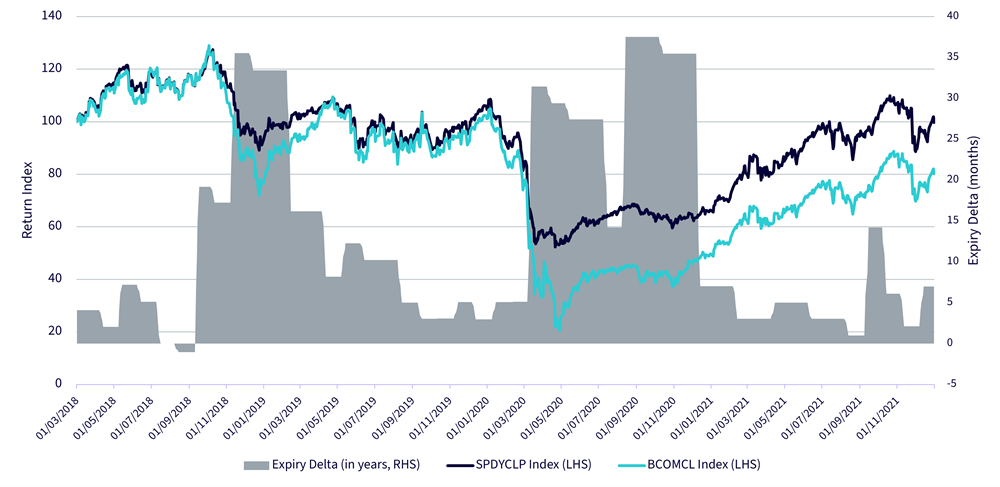
That is when the BCOM strategy regained some ground, but far from making up for the lost performance. Finally, the curve switched back to backwardation at the end of 2020, prompting EBCIWTT to move back to the front part of the curve. Figure 6 shows the performance of the two strategies during this period. The dark blue line represents the EBCI strategy for WTI only, while the light blue is the WTI BCOM strategy. The grey area (RHS) represents the delta in expiry between the BCOM contract and the EBCI contract.
Figure 6: Flexible maturities help optimised strategies outperform – oil example
Source: Bloomberg, WisdomTree. Historical performance is not an indication of future results and any investments may go down in value.
Conclusions
The WisdomTree Enhanced Commodity UCITS ETF (WCOA) offers an optimised roll strategy, which has the distinct advantages of having better long-term returns, lower volatility, lower drawdown risk and a better ability to deal with shock events than simple front-month following strategies like the BCOM.
Sources
1 See The Case for Investing in Broad Commodities
2 See The Case for Investing in Broad Commodities
3 With the exception of Gold, Silver, Soybean Meal and Soybean Oil, that do not follow the Dynamic Roll methodology.