
Key Takeaways
- WisdomTree US Quality Growth UCITS ETF provides US growth exposure without sacrificing quality. It is a superior fundamentals-based stock selection alternative to market capitalisation-based selection.
- The last 60 years of US market data indicate that within high-growth stocks, the dispersion of returns between high-quality and low-quality is the largest over the growth spectrum, with high-quality stocks outperforming low-quality stocks by close to 9% annualised returns, making the blend essential for a robust portfolio.
- WisdomTree’s strategy results in a high conviction portfolio with high active share versus the S&P 500 Index, and a dynamic portfolio that adjusts to quality and growth tilts.
- Related ProductsWisdomTree US Quality Growth UCITS ETF – USD AccFind out more
WisdomTree has recently launched the WisdomTree Quality Growth UCITS ETF, which seeks to provide investors with a unique exposure to growth in the US market without sacrificing on quality. Contrary to some existing growth proxies of the growth in the US market, the WisdomTree Quality Growth UCITS ETF takes a holistic fundamentally driven approach to portfolio construction. In this blog, we take you through the thought process behind the newly launched ETF.
Identifying growth stocks
A few common measures used to identify growth stocks include trailing sales and earnings growth, future sales and earnings growth estimates, and relative valuations like price-to-earnings, price-to-sales, and price-to-book ratios. Because earnings-based measures of growth may be undefined for loss-making growth companies, growth strategies may ignore profitability considerations in favour of metrics like price-to-sales and price-to-book as proxies for growth. At times growth investors become enamoured with more narrow non-earnings growth measures like ‘eye-balls’ during the internet craze of the early 2000s or ‘subscriber-growth’ in recent years as it relates to streaming platforms and social media companies. This can lead to an approach to growth that over-weights highly speculative or junky growth names. Alternatively, some investors have been considering focusing on quality stocks – companies with higher profitability – to implicitly tilt towards profitable growth stocks. But ignoring explicit growth signals can exclude some of the fastest growing companies, diluting the intended growth exposure. The WisdomTree US Quality Growth Index identifies stocks with quality and growth characteristics to avoid sacrificing either factor.
Blending quality with growth
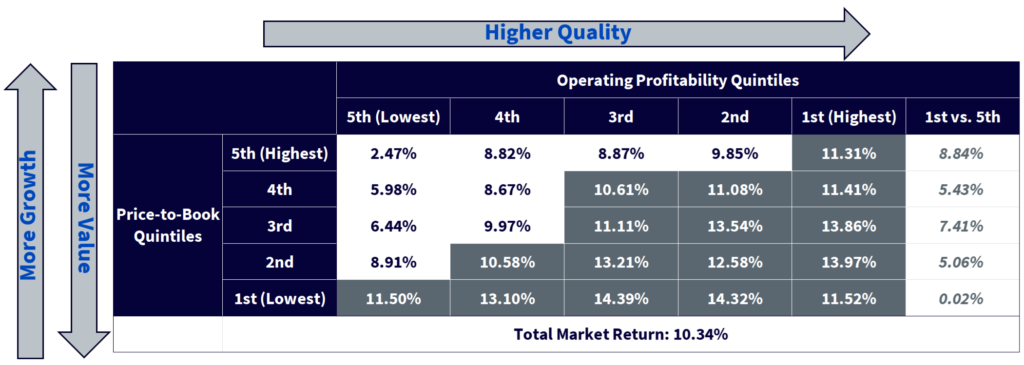
Investors are familiar with the standard value, blend, and growth styles. So why blend quality with growth? Higher operating profitability (higher quality) has outpaced lower quality over time. And that outperformance has been most pronounced in the market’s higher growth (less value) segments. In the below table the highest profitability quintile (1st quintile) outperformed the broad market controlling for valuation (price-to-book). When looking at the 5th quintile on price-to-book (the least value/most growth quintile), there was a spread of 8.84% annually between the highest and lowest profitability quintile. These historical returns suggest that investing in growth stocks can be a losing game over the long run. We believe investors should instead consider investing in high-quality growth stocks.
US Market Quality-Growth Matrix
WisdomTree US Quality Growth UCITS Strategy
Lorem ipsum dolor sit amet, consectetur adipiscing elit. Ut elit tellus, luctus nec ullamcorper mattis, pulvinar dapibus leo
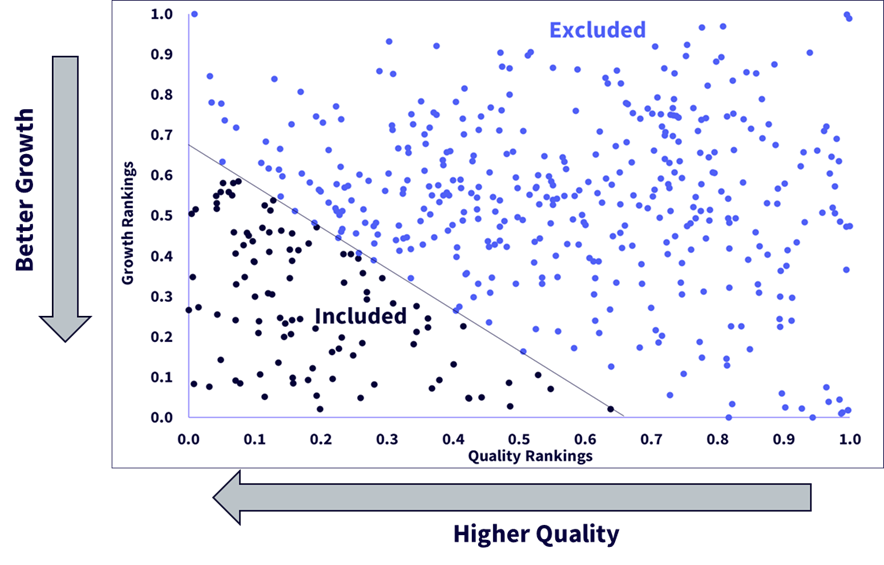
The WisdomTree US Quality Growth UCITS Index is a market-cap-weighted index consisting of companies with quality and growth characteristics. The top 500 US companies that satisfy the WisdomTree ESG criteria and are listed on any of the major US exchanges by market capitalisation are ranked on a composite score of two fundamental factors: growth and quality, which are equally weighted. The Index comprises the 100 US companies (the first quintile) with the highest composite scores.
Growth factor: The growth factor is determined by a company’s ranking based on a 50% weight in its median analyst earnings growth forecast, a 25% weight in its trailing five-year EBITDA1 growth and a 25% weight in its trailing five-year sales growth.
Quality factor: The quality factor is determined by a company’s ranking based on a 50% weight to each of its trailing three-year average return on equity and trailing three-year average return on assets.
Visual representation of the selection process
Conclusion: A growth-oriented portfolio of high-quality stocks with high active share
The index is intended to be a high-conviction, relatively concentrated growth portfolio aimed at selecting high-quality, high-growth companies. As a result, the resulting portfolio has a high active share and a high percentage weight allocated to the top 10 holdings.
| WisdomTree US Quality Growth UCITS Index | |
| # Stocks | 100 |
| Active Share vs. S&P 500 | 58.7% |
| Top 10 holdings | Weight |
| Microsoft Corporation | 14.2% |
| Apple Inc. | 11.6% |
| NVIDIA Corporation | 10.9% |
| Alphabet Inc. Class A | 9.2% |
| Amazon.com, Inc. | 9.2% |
| Meta Platforms Inc Class A | 6.1% |
| Broadcom Inc. | 3.0% |
| Visa Inc. Class A | 2.8% |
| Tesla, Inc. | 2.7% |
| UnitedHealth Group Incorporated | 2.2% |
| Total | 72.0% |
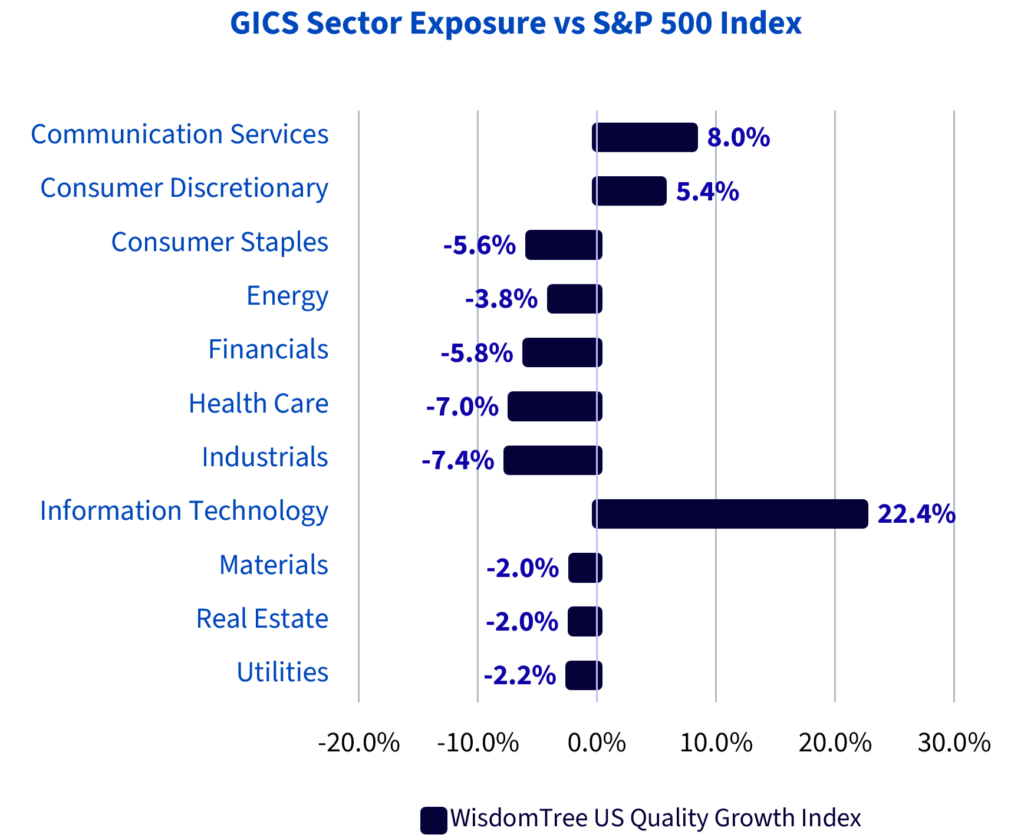
Sector weightings adapt to quality and growth tilts
The resulting sector weights adapt dynamically to quality and growth tilts, and at present, indicate high exposure to ‘Information Technology’ and overweight to ‘Communication Services’ and ‘Consumer Discretionary’.
Sources
1 Earnings before interest, taxes, depreciation, and amortisation.