
Equity markets continued to rise in the second quarter of the year, albeit more slowly. The MSCI World index gained 6.8% over the quarter, US equities rose 8.6%, and European equities rose 2.3%1. The performance drivers remained the same with mega caps, tech mega caps in particular, creating the bulk of the performance.
This instalment of the WisdomTree Quarterly Equity Factor Review aims to shed some light on how equity factors behaved in this complicated quarter and how this may have impacted investors’ portfolios.
- Growth stocks continue to lead in developed market equities; a sharp reversal to 2022
- The best factors for 2022 continue to suffer as well, with Value and High Dividends posting sharp underperformance
- In Emerging Markets, the picture is quite different with Value and Size leading the way
Year-to-date equity gains have been concentrated in a handful of expensive names, with equity markets currently pricing a perfect outcome (that is, inflation coming down nicely, growth remaining resilient, and unemployment staying low). Uncertainty remains very high and there are potential opportunities to be found among the laggards, including in defensive or cheaper side of the markets.
Performance in focus: a reversal of 2022
Q2 saw a continuation of the trend that started in Q1. Big tech stocks benefitted from the positive sentiment around generative artificial intelligence (AI) and AI in general, with stocks like Nvidia posting returns of 52.3% during the quarter (after +90% in Q1 already). Equity markets overall were buoyed by optimism on the trajectory of US inflation and by unemployment remaining surprisingly resilient. Overall, 2023 continues to look like the anti-2022: growth stocks are up, Bitcoin is up (83.7% year-to-date), and High Dividend and Value are down. This sharp turnaround highlights, once again, the importance of diversification.
The year remains a difficult period for factor investing in developed markets:
- Growth stocks performed the best in Q2, outperforming by 3.6% globally and 5.2% in the US
- Quality continues to be the second-best factor for the quarter in developed markets, in particular when loading on more expensive tech stocks.
- In developed markets, other factors like Value, High Dividend and Min Volatility all suffered from the change in regimes compared to last year.
- As a testament to the sharp reversal in sentiment/performance, Momentum is posting the worst performance year to date globally and in the US as it could not adjust to the rapid change.
- In emerging markets, Size and Value dominate but most factors were able to produce outperformance over the quarter
Figure 1: Equity factor outperformance in Q1 2023 across regions
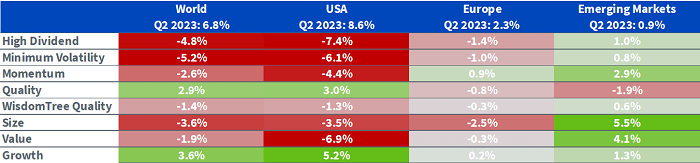
Source: WisdomTree, Bloomberg. 31 March 2023 to 30 June 2023. Calculated in US dollars for all regions except Europe, where calculations are in EUR.
Historical performance is not an indication of future performance and any investments may go down in value.
2023 has been very consistent factor wise
Looking back at the full six months, the picture is quite coherent. Growth outperformed in 5 out of 6 months, underperforming only by -0.2% in April. It outperformed by more than 2% in half the months (January, March and May). High Dividend underperformed almost every month with a 0.1% outperformance in April, saving it from a ‘perfect’ streak.
Figure 2: World equity factor outperformance month by month in the first half of 2023
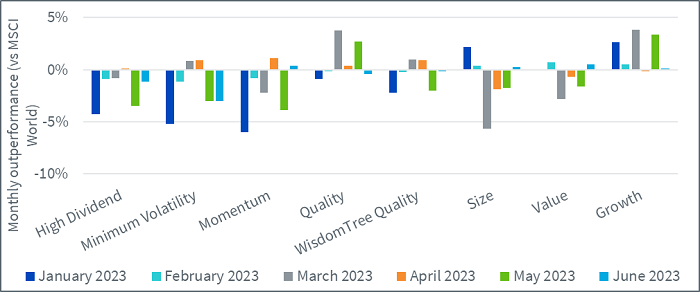
Source: WisdomTree, Bloomberg. 31 December 2022 to 30 June 2023. Calculated in US dollars for all regions except Europe, where calculations are in EUR.
Historical performance is not an indication of future performance and any investments may go down in value.
A very concentrated recovery
Looking at the performance of the S&P 500 year-to-date (+16.6%), almost three quarters of it has been created by the ten biggest stocks in the index. Those stocks only represent 27% of the weight in the index. Figure 3 shows, for each stock, its weight in the index and how much it contributed to the index’s half-year performance. Every stock that sits above the red line contributed more than what its weight would entail. Clearly, the eight tech stocks in the S&P 500 top 10 have all contributed very positively, explaining most of the performance of the index.
Figure 3: Weights and contribution to first half 2023 performance of individual stocks in the S&P 500
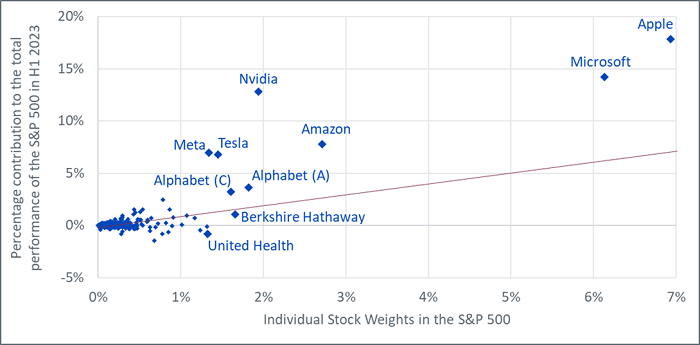
Source: WisdomTree, Bloomberg. From 31 December 2022 to 30 June 2023.
Historical performance is not an indication of future performance and any investments may go down in value.
Valuations continued to increase in Q1
In Q2 2023, markets continued to get more expensive on the back of good performance. However, this average increase hides discrepancies. Growth got more expensive quickly and is showing price-to-earnings ratio (P/E ratio) of more than 30 in the US. However, Value remains very cheap at 7.2 in the US and 9.4 for developed markets. This is also the case for High Dividends with low double digits valuations. Momentum’s valuation is rising fast, a clear sign that the basket is shifting away from cheap Value to expensive Growth. The next few months will tell us if it was too late.
Figure 4: Historical evolution of price to earnings ratios of equity factors
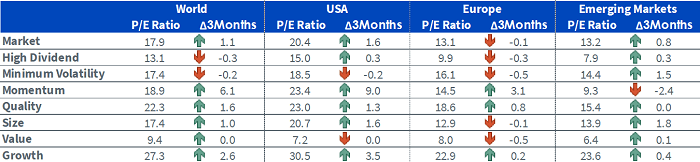
Source: WisdomTree, Bloomberg. As of 30 June 2023.
Historical performance is not an indication of future performance and any investments may go down in value.
Looking forward to the rest of 2023, it feels like markets are pricing a perfect outcome with inflation coming down nicely, growth remaining resilient and unemployment staying low. Overall, uncertainty remains very high and interest rate volatility continues to be very elevated across the world. US optimism could unravel quickly. With year-to-date gains concentrated in a handful of expensive names, there are potential opportunities in some of the laggards, including in defensive or cheaper side of the markets.
World is proxied by MSCI World net TR Index. US is proxied by MSCI USA net TR Index. Europe is proxied by MSCI Europe net TR Index. Emerging Markets is proxied by MSCI Emerging Markets net TR Index. Minimum volatility is proxied by the relevant MSCI Min Volatility net total return index. Quality is proxied by the relevant MSCI Quality net total return index.
Momentum is proxied by the relevant MSCI Momentum net total return index. High Dividend is proxied by the relevant MSCI High Dividend net total return index. Size is proxied by the relevant MSCI Small Cap net total return index. Value is proxied by the relevant MSCI Enhanced Value net total return index. WisdomTree Quality is proxied by the relevant WisdomTree Quality Dividend Growth Index.
1 Source: all data Bloomberg, WisdomTree, 30 June 2023.