

Inflation and secular trends push up prices for stocks, goods and services over the long term. But over the short term? In this article, Portfolio Manager Aneet Chachra shows the impact even moderate changes in flow dynamics (and demand) can have on prices … for both minivans and markets.
Key Takeaways
- Prices, on average, rise during weeks when money flows into stocks, and fall in weeks when money flows out of stocks.
- Even a modest net flow imbalance can result in a meaningful S&P 500 move; the price of stocks can quickly change in response to a minor change in supply/demand or participant dynamics.
- Flexibility and patience can enable adaptive participants to benefit from temporary pricing dislocations created by inflexible flows, strategies and people.
Just over a decade ago, my wife and I were expecting our second child and needed a vehicle that could accommodate two car seats, strollers, parents and luggage. After some quick analysis, we became proud owners of a minivan. It has been a phenomenal vehicle that has carried our family 100,000+ miles without incident.
We purchased a minivan for convenience and safety, but it also turned out to be a possible source of alpha. According to the academic paper “Sensation Seeking and Hedge Funds”1 – “sports car drivers underperform non-sports car drivers by 2.92% per year, while minivan drivers outperform non-minivan drivers by 3.22% per year.” I have no idea whether this fund performance research is accurate. But car insurance rates for minivans are low, indicating their owners have few accidents.
Our second child is now 10 years old and likes to tell friends – “our car is older than I am.” Given advancements in safety technology, we decided it was time to upgrade to a new model. While I had read about car shortages, I naively assumed that an uncool vehicle like a minivan could not possibly be in high demand.
I was wrong. Dealer websites would show minivans available at sticker price, but contacting them would reveal surcharges, hidden fees and useless “mandatory” accessories. The actual price for immediate delivery was $2,000 to $7,000 above manufacturer’s suggested retail price. I kept asking why prices were so high and every exasperated salesperson replied similarly: “We aren’t getting many cars and people are rushing to buy whatever we do get. And when someone really wants a car, they will pay a few thousand extra.”
It is easy to see how price-insensitive buyers with ready cash push vehicle prices up. However, similar “money flow” effects are less obvious but also true for U.S. equities. We can show this via fund flow data.
The Investment Company Institute (ICI) publishes fund industry statistics. One data series is weekly net fund flow into U.S. equities (aggregating both mutual funds and ETFs). This particular series starts in 2013, so has 450 weekly data points so far. Flows are volatile but there have been net inflows in roughly half of the weeks, and net outflows in the other half.
We normalize this weekly flow from millions of dollars into a percentage of U.S. equity market capitalization to reflect change in market size over time. We then compare these net fund flows to S&P 500® Index price changes in the same week.
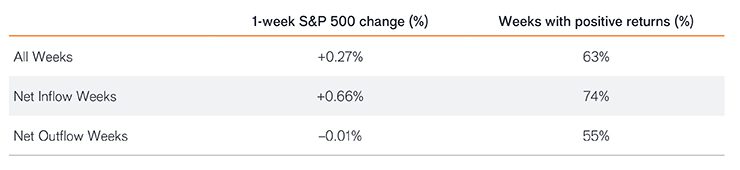
During weeks with net equity fund inflows, the S&P 500 went up by an average of +0.66% per week.
During weeks with net equity fund outflows, the S&P 500 went down by an average of -0.01% per week.
All S&P 500 returns (and more) since 2013 have come during weeks with positive net fund flow.
Exhibit 1: Weekly net fund flow (inflow/outflow) vs. S&P 500 price change (%)
We can’t directly trade on this spectacular relationship as fund flows and their corresponding price moves happen together. Fund flow data is released with a lag. Absent a time machine, predicting fund flows in advance is about as hard as predicting stock prices in advance.
But this does show that prices, on average, rise during weeks when money flows into stocks, and fall in weeks when money flows out of stocks. Flows impact price.
Now theoretically, fund flows should not matter as every buyer is matched with a seller, and both transact at the “efficient markets” price. For every market participant reducing cash by buying shares, there is another market participant increasing cash by selling shares.
However, Exhibit 1 shows an observable relationship exists between net fund flows (in both directions) and concurrent price changes. Empirically, fund flows do matter.
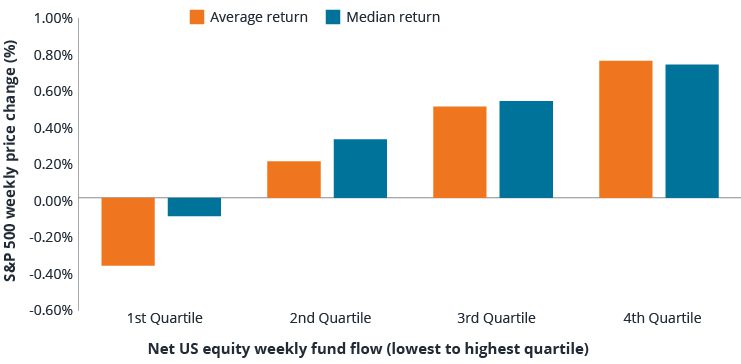
Exhibit 1 only looked at the direction of the fund flow, not the magnitude. If there is a real and not spurious association between flows and prices, there should also be a link between flow size and flow-induced price changes. To test this, we bucketed weekly flows into four quartiles ranging from lowest to highest. Exhibit 2 shows average and median weekly S&P 500 returns for each quartile. The relationship is indeed monotonic – larger flows (on average) result in a larger price impact.
Exhibit 2: Net fund flow quartile is positively correlated with stock market returns
Weekly fund flows are notoriously choppy. Similarly, market prices are also volatile week to week. Thus, while the flow versus price relationship is clear from looking at the aggregated data, this relationship is weaker (but still visible) in a scatterplot of individual weeks (Exhibit 3). Weekly net flow and price moves have a positive correlation of +0.24.
Exhibit 3: Weekly S&P 500 price change (%) vs. net fund flows (bps)
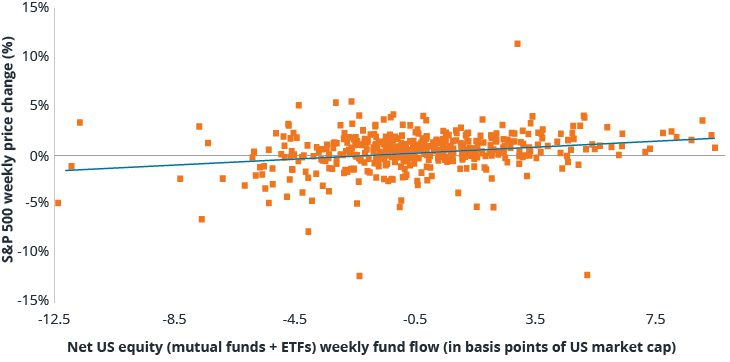
Importantly, the slope of the best-fit regression line (the blue line in Exhibit 3) provides a rough estimate of the price impact of fund flows. With the obvious caveat that there is considerable dispersion, the average multiplier is roughly 15x. For example, 5 basis points (+0.05%) of net inflow into U.S. equities over a week is associated with a +0.75% rise in the S&P 500.
To put this into context, total U.S. market cap is currently about $50 trillion – thus a 5 basis point net inflow is about $25 billion. This relatively small amount being material indicates considerable inelasticity in short-term market prices. It shows that a modest net flow imbalance results in a meaningful S&P 500 price increase or decrease.
There may be other confounding factors but nevertheless fund flows are a significant driver of index price moves. Broadly, the market clearing price of stocks can quickly change in response to a minor change in supply/demand or participant dynamics. Flows and prices can shift fast.
This is true for minivans as well. A month after postponing our purchase, I suddenly started getting calls from dealers offering much better deals. New supply is arriving soon while the most motivated buyers have already purchased ahead of school reopenings. The asking price for a minivan has quickly fallen by several thousand dollars. The extreme car buying frenzy has cooled, although prices remain well above pre-COVID levels.
My minivan saga is a microcosm of broader economic forces. Over the long run, inflation and secular trends push prices of stocks, houses, new cars and most goods or services higher over time. However, short-term flow dynamics can cause large price deviations both positive and negative along the way. Flexibility and patience can enable adaptive participants to benefit from temporary pricing dislocations created by inflexible flows, strategies and people.
1 Brown, Lu, Ray, Teo, “Sensation Seeking and Hedge Funds.” Journal of Finance, December 2016.
Link: https://papers.ssrn.com/sol3/papers.cfm?abstract_id=2882983