

Templeton Global Equity Group highlight that the weaker Japanese Yen is thought of as positive for Japanese businesses with a high degree of exports, but it may not necessarily be as beneficial as many think.
Despite what we believe to be attractive investment opportunities across Japan, we would be remiss not to recognize the considerable weakness exhibited by the Japanese Yen (JPY) year to date, which has seen a nearly 14% depreciation relative to the US dollar since the start of the year.1 This weakness has been driven in part by remarks from the Bank of Japan (BOJ), which has indicated its intention to maintain a relatively accommodative monetary stance— in contrast to policy measures of other global central banks. Across several other regions, governments and policymakers are seeking to combat historically high rates of inflation by either tapering asset purchases or increasing policy rates. Notably, comments from other central banks throughout the course of the first quarter of 2022 suggest that the move to higher interest rates may potentially be more aggressive than previously estimated, after sequential inflation readings reached multi-decade highs.
Despite this, the BOJ’s Governor Haruhiko Kuroda has expressed views that a weak yen is generally positive for the overall Japanese economy. This may be true if resulting inflationary effects help to reverse a “deflationary mindset” prevalent across Japan (where consumption has been delayed in anticipation of prices being lower in the future). The spectre of inflation may induce individuals and businesses to curtail savings and instead purchase goods and services ahead of anticipated higher future prices. Additionally, a weaker yen may also be beneficial by positioning Japanese export goods more competitively relative to global peers.
While a weaker JPY can generally be thought of as positive for Japanese businesses with a high degree of exports, this may not necessarily be as direct of a relationship as intuition would suggest. Analysis of trailing historical correlations for the last 20 years would suggest that the inverse relationship between the value of the yen and gains in the Tokyo Stock Price Index (TOPIX) has varied considerably. While this relationship holds true most of the time (~4/5ths of the period shown below exhibit an inverse relationship), ~1/5th of the observations below exhibit a zero or positive correlation between JPY strength and the TOPIX.
Correlations between the Japanese Yen and TOPIX can vary over time
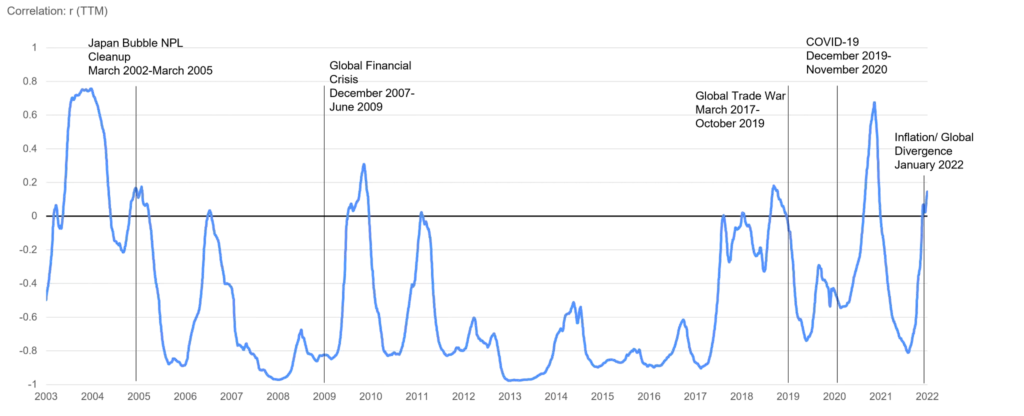
In general, we find that in periods where the global economy is resilient, there tends to be a strong inverse relationship between JPY strength and the TOPIX (i.e.- r= -1), with the logic that a weak JPY facilitates sales to strong end markets.
However, this relationship tends to break down and the correlation coefficient r tends to drift towards 0 (or positive)2, indicating a weak or positive relationship in periods of where there is yen weakness, and more uneven global growth (see global financial crisis, global trade disputes, et al.). This could be potentially the result of either reduced demand from end markets, or protectionist measures.
In the current year-to-date period, we find the expected inverse relationship between the JPY and TOPIX to be more muted, and suspect this may be the result of a more nuanced and unusual combination of factors, including, but not limited to:
a. Significant monetary policy divergence between the US and Japan.
b. Material reliance on energy imports, an acute headwind for the country.
c. Notable dispersions in demand outlook across Japan’s key export markets.
Accordingly, while it is estimated that companies in the TOPIX derive approximately 40%3 of their revenues from non-JPY sources, a weaker JPY could also potentially result in an erosion of profit margins stemming from extraordinary levels of energy inflation (something which may not be possible to pass on in terms of price increases, or, in doing so, could erode competitive positions). As a result, it is not immediately clear that a weaker yen would necessarily yield higher profits for companies in the TOPIX.
While the observations are not intended to represent a comprehensive analysis on the Japanese yen, this discussion does highlight some nuances of investing in the Japanese market and the sorts of market catalysts that may create investment opportunities.
While considerations such as those outlined above can make selecting individual Japanese equities challenging, we believe the Japanese market can offer valuable geographical diversification within a portfolio and access to a number of unique companies without true competitors. The Japanese market has also been the beneficiary of rising profitability and an increased focus on shareholder returns and corporate governance (See our previous paper “Japan: Land of rising equity opportunities,” for more details).
By adopting a long-term orientation focused on price discipline and identification of value, Templeton Global Equity Group is well positioned, in our view, to take advantage of potential opportunities in Japan, even in a difficult environment such as the current great wave of JPY weakness.
- YTD through April 28, 2022.
- Correlation coefficient (r) refers to a statistical measure of the strength of relationship between two variables and ranges in value between -1 and 1; a measure of -1 suggests a perfectly negative (inverse) relationship, whereas a measure of 1 suggests a positive (direct) relationship. A value of 0 indicates no relationship.
- Sources: FactSet, Templeton Global Equity Group estimates, As of April 2022.