

US commercial real estate (CRE) investment performance continued to soar in the fourth quarter of 2021 with wide disparities between property types. The National Council of Real Estate Fiduciaries (NCREIF) Property Index results were strong with a total return of 17.7% for 2021. Income return amounted to 4.2% and capital appreciation amounted to 13.1% for the past year. The industrial sector produced a total return of 43.3% for 2021, followed by the apartment sector producing a 19.9% total return. In comparison, retail and office produced a total return of 4.2% and 6.1%, respectively.1 Fundamentals for US CRE remains solid as economic data published for the fourth quarter continues to suggest strong but slower growth heading into 2022. Covid-19 and inflation remain the most significant economic concerns for investors. Inflation continued to rise in the beginning of 2022 with energy prices surging as a result of Russia’s attack on Ukraine and associated sanctions on Russian energy exports. As a result, the US Federal Reserve (Fed) has accelerated the target of tapering its asset purchases to the end by March, with at least three potential rate hikes in 2022.
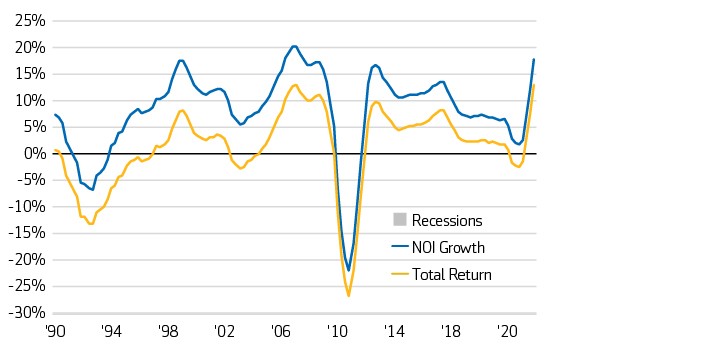
NCREIF total return, capital return and income return
Year-over-year change (1990-4Q 2021)
Another Covid-19 winter may prolong feast and famine for US CRE
Recently released fourth quarter and annual 2021 US CRE investment performance data show a continuing pattern of feast or famine across the four major sectors. Feasting in the industrial sector has produced a total return of 43.3% for 2021, followed by a less lavish feast in the apartment sector producing a 19.9% total return. In comparison, famine might be an apt description for the 4.2% total return in the retail sector making the 6.1% in the office sector comforting.1
The ongoing Covid-19 pandemic explains some of the disparate investment performance across the sectors. Demand for Industrial space is roaring as online retail sales now account for 13% of total retail sales up from 11% in the fourth quarter of 2019. That increase represents a 42% increase in e-commerce sales.2 With this tailwind, net absorption of industrial space in 2021 approached 3% of the total inventory, the strongest net absorption on record.3 Apartment performance was indirectly boosted by Covid-19 through the strong employment recovery propelled by government spending to support households and businesses.
At the other extreme, Covid-19 has kept offices closed while staff works from home. The work-from-home experience is showing solid if not enhanced productivity along with pervasive employee desire to maintain flexibility to work-from-home part of the week when offices reopen. Eventual impact on office space is uncertain. Part-time work-from-home could allow a cutback in leased office space but only if space is used in a flexible fashion. At the same time, employees will require more square footage to mitigate the increased desire for distancing. The uncertainties are roiling expectations for office demand and property value post-Covid-19.
The woes in the retail sector were not so much caused by Covid-19 as accelerated by it. Online shopping has been taking an increasing bite out of in-store retail sales for the last two decades. The Covid-19 shutdowns accelerated the incursion and re-pricing of obsolete retail space.
Strong economic growth in the fourth quarter of 2021 will likely continue to benefit overall commercial property investment performance into 2022 as economic growth is the engine that leads the demand for space. Fourth quarter GDP posted a very strong 6.9% annualized real gain versus the much more anemic 2.3% real growth rate posted for the second quarter of last year. Real GDP growth for 2021 overall was 5.7% reflecting the bounce-back from the Covid-19 downturn of -3.4% in 2020. Real GDP recovered and surpassed the pre-Covid peak in the second quarter of 2021. The recovery was aided by the 8.1% growth in federal non-defense spending in 2020 comprised largely of Covid-19-related support.4
This year, forecasters included in the February 2022 Blue Chip Economic Survey are expecting a slower pace of real growth at 3.7% with the consumer price index rising 5.0%. Growth and inflation at these magnitudes are well above the +/- 2% growth and inflation trends in place since 2001. More normal performance is forecast for 2023 with 2.6% real GDP growth and 2.5% inflation.5 These expectations are based on confidence that Fed policymakers will be successful in normalizing monetary policy and easing inflation without crippling economic growth. The first steps in monetary tightening are underway now as the Fed shrinks the pace of purchasing Treasury and other bonds aiming to eliminate the purchases in this year’s first quarter. The beginning of interest rate tightening is expected to follow in subsequent months. Anticipating this pace of monetary normalization, financial markets were nudging Treasury yields higher with daily trading producing a 2.0%+ yield high in mid-February but surging uncertainty accompanying Russia’s attack on Ukraine lowered yields to around 1.75% in early March.6 In 2023, Blue Chip forecasters are expecting the 10-year Treasury yield to average 2.5%.5 It is worth noting that Treasury levels at such levels are still rock bottom low in an historical context. Since the beginning of 2012, the 10-year Treasury yield has posted a quarterly average above 3% only once, in 4Q 2018.6
Substantial uncertainties accompany these sanguine expectations. In late 2021, Covid-19 contagion entered a third wave with the emergence of the Omicron mutation. While less deadly than prior versions, Omicron is still challenging health care providers and disrupting economic activity. Covid-19 is largely responsible for the inflation surge due to the combined effects of shifting consumer spending toward goods and away from services and disruption to production and movement of goods. Even after Covid-19 contagion eases, it will take some time to reverse the disruption. As of early March, the pace of contagion is down sharply on a week-to-week basis but not enough to mark an end to the pandemic.
At the same time, the economy is challenged by labor force constraints that are making it very difficult to fill job openings. Baby boomer retirements, shrinkage in immigration, and difficulties for caregivers associated with daycare and school interruption are the major culprits. When fear of Covid-19 finally eases, some Baby Boomers might return to the workforce especially with the allure of higher wages. Immigration might also pick-up and caregiver issues might resolve. But the US will nonetheless remain short of labor as shown in pre-Covid data. As shown in the February employment report, employment remained 1.4 million jobs below its pre-Covid peak.7 Very anemic population growth is offering little hope of relief. In 2019, prior to Covid-19, the US population grew by only 0.5%, a pace weak enough to keep a lid on upside in US economic growth.8
With the growth and inflation outlooks still dependent on the path of Covid-19, the feast and famine pattern of sector investment performance in US CRE will likely continue through the quarters ahead. With abundant capital and plentiful financing, property investors are acting on their own expectations and analysis of market opportunities.
Sector Prospects
Apartment performance prospects appear to be rock solid for 2022. An overall shortage of available housing, both for-sale and rental, together with need of more space to work from home during the pandemic drove unprecedented demand for apartments. Both rent growth and occupancy reached record highs. With demand and rent growth surging, capital poured into the multifamily sector. Transaction volume for the fourth quarter reached a staggering high of $149 billion.9 In addition, units under construction declined over the past year due to supply and labor constraints, as well as delays in securing approvals and permits, which ensures that demand will outpace supply in most markets for the foreseeable future.10,11 Urban markets that were hit the hardest during the beginning of the pandemic have also bounced back with rent growth turning positive as households return to city centers.
2022 industrial prospects look promising with longer-term risks revolving around whether demand can absorb sizeable new warehouse supply, especially when the economy starts to normalize. Consumers that were flush with cash from stimulus checks have started to draw down their excess savings, driving a surge in retail sales both in-store and online. As a result, the industrial sector’s vacancy rate declined at the fastest pace on record for 2021 to 4.2%.11 Transaction volume surged to $67 billion in the fourth quarter of 2021, an 82% increase from the volume seen in the pre-pandemic fourth quarter of 2019.9 Developers are racing to keep pace with tenant demand. Space under construction as a percentage of inventory reached 3.0%, the highest ever recorded.11 Additionally, developers in major markets can barely accommodate demand, causing new construction to spill over to nearby markets where land is less constrained.
The emergence of the Omicron variant pushed the office market’s uncertain future further into 2022. Companies that planned to reopen their offices in early 2022 have had to rethink their plans once again. Leasing activity remains below pre-pandemic averages as tenants either cut back on space or put off making decisions. The amount of available sublet space remains at historically high levels. Vacancy increased from the pre-pandemic rate of 9.7% at the end of 2019 to 12.2% at the end of 2021. The amount of space under construction as a percentage of inventory in the top 50 metro areas fell from 2.02% in the fourth quarter of 2019 to 1.72% in the fourth quarter of 2021.11 Transaction volume increased by 22% during the same time period, with suburban market driving the majority of that growth.9
The retail sector ended 2021 on the path to recovery, with total returns for the year remaining modest but surpassing the pre-pandemic levels seen in 2019.1 Consumer spending was propelled by the significant savings and wage growth that government stimulus and a strong labor market created. Leasing activity surged to the highest level in four years, primarily due to smaller footprint and discount retail tenants. The amount of space under construction as a percentage of inventory in the top 50 metro areas remained at an extremely low level of 0.45%, down from the already low level of 0.63% seen pre-pandemic. The increased leasing activity combined with a lack of new construction brought the year-end vacancy rate up to 4.6%, which is on par with the pre-pandemic 2019 year-end rate of 4.5%.11 Retail sector investment transactions reached $32.5 billion in the fourth quarter of 2021, a 56% increase from the pre-pandemic total seen in the fourth quarter of 2019. However, approximately one-third of these fourth quarter sales transactions can be attributed to the merger of Realty Income Corp and VEREIT.9
1National Council of Real Estate Investment Fiduciaries. December 31, 2021.
2US Census Bureau. E-Commerce Report. November 18, 2021.
3JLL Industrial Outlook. September 30, 2021.
4US Bureau of Economic Analysis. Gross Domestic Product. January 27, 2022.
5Wolters Kluwer. Blue Chip Economic Indicators. January 10, 2022.
6Board of Governors of the Federal Reserve System. February 10, 2022.
7US Bureau of Labor Statistics. Employment Situation. March 4, 2022.
8US Bureau of Economic Analysis. January 28, 2022.
9Real Capital Analytics. December 31, 2021.
10National Multifamily Housing Council. NMHC Construction Survey. September 23, 2021.
11CoStar Realty Information, Inc. December 31, 2021.
Important disclosures
Disclosures
This material is provided by Aegon Asset Management (Aegon AM) as general information and is intended exclusively for institutional and wholesale investors, as well as professional clients (as defined by local laws and regulation) and other Aegon AM stakeholders.
This document is for informational purposes only in connection with the marketing and advertising of products and services, and is not investment research, advice or a recommendation. It shall not constitute an offer to sell or the solicitation to buy any investment nor shall any offer of products or services be made to any person in any jurisdiction where unlawful or unauthorized. Any opinions, estimates, or forecasts expressed are the current views of the author(s) at the time of publication and are subject to change without notice. The research taken into account in this document may or may not have been used for or be consistent with all Aegon Asset Management investment strategies. References to securities, asset classes and financial markets are included for illustrative purposes only and should not be relied upon to assist or inform the making of any investment decisions.
The information contained in this material does not take into account any investor’s investment objectives, particular needs, or financial situation. It should not be considered a comprehensive statement on any matter and should not be relied upon as such. Nothing in this material constitutes investment, legal, accounting or tax advice, or a representation that any investment or strategy is suitable or appropriate to any particular investor. Reliance upon information in this material is at the sole discretion of the recipient. Investors should consult their investment professional prior to making an investment decision. Aegon Asset Management is under no obligation, expressed or implied, to update the information contained herein. Neither Aegon Asset Management nor any of its affiliated entities are undertaking to provide impartial investment advice or give advice in a fiduciary capacity for purposes of any applicable US federal or state law or regulation. By receiving this communication, you agree with the intended purpose described above.
Past performance is not a guide to future performance. All investments contain risk and may lose value. This document contains “forward-looking statements” which are based on Aegon AM’s beliefs, as well as on a number of assumptions concerning future events, based on information currently available. These statements involve certain risks, uncertainties and assumptions which are difficult to predict. Consequently, such statements cannot be guarantees of future performance, and actual outcomes and returns may differ materially from statements set forth herein.
The following Aegon affiliates are collectively referred to herein as Aegon Asset Management: Aegon USA Investment Management, LLC (Aegon AM US), Aegon USA Realty Advisors, LLC (Aegon RA), Aegon Asset Management UK plc (Aegon AM UK), and Aegon Investment Management B.V. (Aegon AM NL). Each of these Aegon Asset Management entities is a wholly owned subsidiary of Aegon N.V. In addition, the following wholly or partially owned affiliates may also conduct certain business activities under the Aegon Asset Management brand: Aegon Asset Management (Asia) Limited (Aegon AM Asia), Aegon Private Fund Management (Shanghai) Co., Ltd
Aegon AM UK is authorised and regulated by the Financial Conduct Authority (FRN: 144267) and is additionally a registered investment adviser with the United States (US) Securities and Exchange Commission (SEC). Aegon AM US and Aegon RA are both US SEC registered investment advisers. Aegon AM US is also registered as a Commodity Trading Advisor (CTA) with the Commodity Figures Trading Commission (CFTC) and is a member of the National Futures Association (NFA). Aegon AM NL is registered with the Netherlands Authority for the Financial Markets as a licensed fund management company and on the basis of its fund management license is also authorized to provide individual portfolio management and advisory services in certain jurisdictions. Aegon AM NL has also entered into a participating affiliate arrangement with Aegon AM US. Aegon AM Asia is regulated in Hong Kong by the Securities and Futures Commission of Hong Kong for Professional Investors only (under SFC Ordinance Cap 571); in China, Aegon Private Fund Management (Shanghai) Co., Ltd is regulated by the China Securities Regulatory Commission (CSRC) and the Asset Management Association of China (AMAC) for Qualified Investors only; In Taiwan Neither Aegon Asset Management nor any of its affiliates are registered and may not sell, issue, or offer any products or services while in Taiwan. Marketing is intended to Professional Investors only has not been reviewed or endorsed by any regulatory authority in Taiwan; In Korea, Aegon USA Investment Management (AUIM) is registered as a CB-DIM and delegates Aegon Asset Management (Asia) Ltd to provide marketing and client services in Korea. Intended for Qualified Professional Investors only and contents have not been reviewed or endorsed by any regulatory authority in Korea; In Japan, neither Aegon Asset Management nor any of its affiliates carry on investment business. Intended for accredited, expert or institutional investors only and contents have not been reviewed by the Financial Services Agency of Japan.
©2022 Aegon Asset Management. All rights reserved.
AdTrax: 4422409.1GBL
Exp Date: December 31, 2023