

Boston – As we enter the final weeks before Labor Day, and many check out for that last summer holiday, we offer two perspectives on the floating-rate loan market: Either as a short story, or a longer narrative, loans shine in both versions.
Just as vacationers head off with hopes of clear skies, nature doesn’t always deliver. So here is a quick take on today’s market — definitely a sunny one — and a look at how loans have fared over decades, through cycles with their inevitable bouts of bad weather.
Short story tied to economic reopening
The economy’s reopening, and the growth it spurred, has been very good for corporate credit, including loans. That is reflected in all the fundamental metrics. For example, ratings upgrades for issuers in the S&P/LSTA Leveraged Loan Index have exceeded downgrades in every month since February on a rolling three-month basis.
The trailing 12-month default rate for the index has declined dramatically for the past 10 months to an almost unheard-of 0.5% (versus a long-term average of about 3% and the lowest level the market has witnessed since 2012). Painting a similarly benign credit picture, the distress ratio — which is the percentage of loans trading below $80 — has continued to hover around 1%.
Meanwhile, issuer balance sheets also offer a bright picture. For public filers in the index, revenue and earnings growth — compared with the low points a year ago in the pandemic — are in the positive double digits. Interest coverage, at just under five times, is at an all-time high.
The economy’s rebound is also reflected in the 9.5% trailing 12-month total return for the index, through July 31. Healthy price recovery notwithstanding, the index’s yield to maturity is still 4.3% — 37 basis points (bps) higher than the comparable yield to worst for the ICE BofA U.S. High-Yield Index, and twice the level of yields on many other major U.S. fixed income sectors, as of July 31.
The technical side of the loan market has been as vibrant as the fundamentals. Institutions, as represented by collateralized loan obligations (CLOs), have poured $92 billion in new money this year — the strongest such stretch in years — while mutual funds added another $30 billion. For perspective, that $122 billion total is equivalent to about 10% of the outstanding loan market. It’s great to see growing uptake of this asset class across investor segments, as diversification of the buyer base is inherently a positive.
Of course, corporate issuers have responded by coming to market with a burst of supply, using the proceeds to push out maturity dates, reduce borrowing costs and recapitalize balance sheets — all of which form a positive feedback loop for credit.
Shining over the long term
The longer-term story is summarized in the chart below, which shows 97 quarterly returns since 1997 (the inception of the index), distributed from worst at left to best at right — 81% showed positive returns. The outliers on both sides approximately cancel out, so the median return of 1.44% is just modestly higher than the average of 1.28%. Most returns (51 quarters) are between 1% and 3%.
Distribution of quarterly returns: A long-term story of attractive income
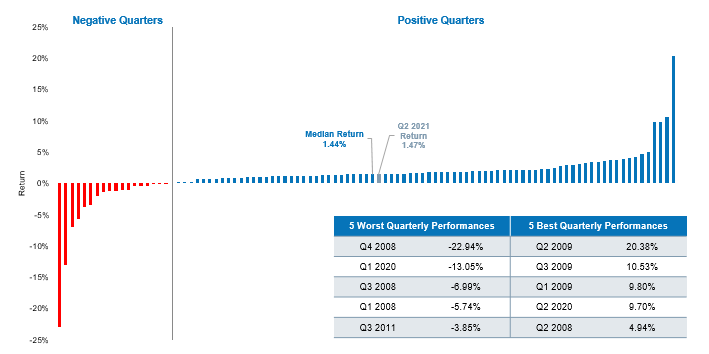
Source: LCD, an offering of S&P Global Market Intelligence, June 30, 2021. Past performance is not a reliable indicator of future results. Performance measures all quarterly returns of the S&P/LSTA Leveraged Loan Index back to its inception in January 1997 and sorts them from lowest to highest. Data provided for informational use only. Indexes are unmanaged, do not reflect the deduction of fees and expenses and are not available for direct investment.
The takeaway is that loans have provided attractive, steady income over more than two decades, with occasional periods of volatility largely driven by brief episodes like the 2008 financial crisis or the 2020 pandemic. Note that after the outsized gain of the past 12 months, the second quarter return was 1.47% — right in line with the long-term median. It is, if you will, a “return to normalcy” — a return to the coupon.
Yield alone is not everything, however. Another key facet of the long-term picture is the “anti-bond” nature of loans, which is so important today. With near-zero duration, loans have tended to outperform when broad fixed income markets do poorly. Look back no further than the first quarter of this year. Investors who are warily eyeing inflation’s return should note that the long-term correlation of loans with U.S. Treasurys has been negative 0.37 for the trailing 10 years.
This negative correlation has held up very well recently. As U.S. Treasurys lost 3% over the past 12 months ended July 31, loans gained 9.5% — that’s 1,250 bps of outperformance. The Bloomberg Barclays U.S. Aggregate Index was down 0.7% over that period, underperforming loans by 1,020 bps.
Bottom line: We believe loans have proved their mettle as economic growth has heated up, and also over longer stretches, through markets far less pleasant than a nice run of summer days.
S&P/LSTA Leveraged Loan Index is an unmanaged index of the institutional leveraged loan market.
ICE BofA U.S. High Yield Index is an unmanaged index of below-investment grade U.S. corporate bonds.
Bloomberg Barclays US Aggregate Index is an unmanaged index of domestic investment-grade bonds, including corporate, government and mortgage-backed securities.