In our latest round-up of developments in financial markets and economies, we look at what’s causing government bonds to underperform and what this means for risk assets.
Last week was a relatively constructive one for risk assets, with volatility, as measured by the VIX, falling from 19 to 15.1 Global equities were up, led by Hong Kong’s Hang Seng index, which rose almost 9%; high-yield credit outperformed investment grade, with US dollar-denominated credit slightly outperforming its euro-denominated counterpart. Commodities were range bound, and the US dollar slightly depreciated.
The one asset class that continues to underperform is government bonds. Except for China, global government bond yields across the entire curve are at, or within a few basis points (bps) of, their 2024 highs. Using 5-year government bonds as our reference, US and UK yields have risen more than 80bps this year, more than 50bps in Germany, France and Australia, and 27bps in Japan.
What’s behind rising yields?
If we separate a bond into its inflation and growth (real yield) components,2 are inflation fears or growth greed causing nominal yields to rise?
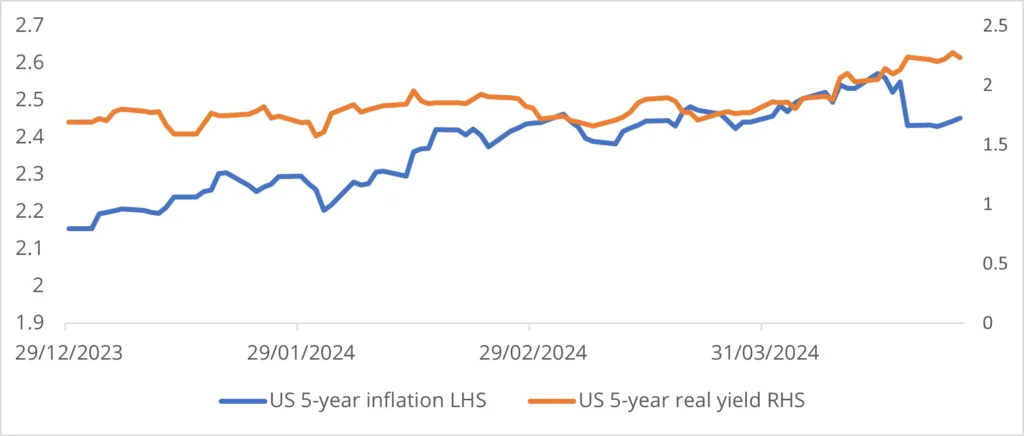
For the US, the inflation component of the 5-year government bond has risen from 2.15% to 2.45%, a 14% increase in the fear factor.3 The real yield component has increased from 1.69% to 2.24%, a rise in greed of 33%.
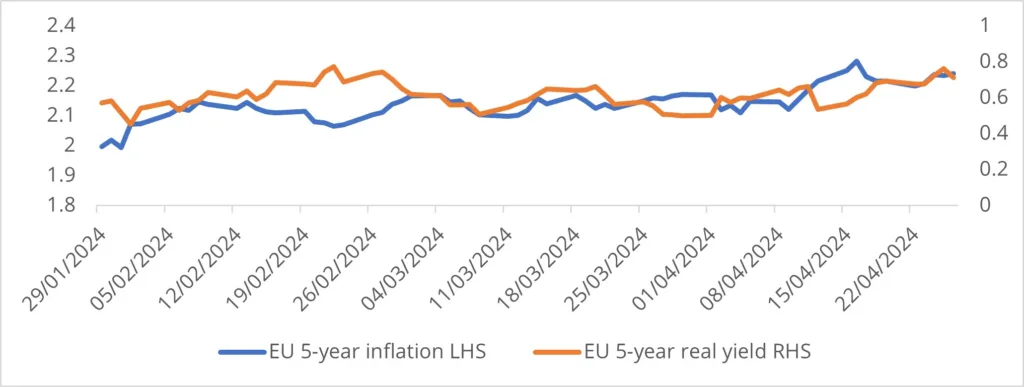
For Europe, using the European interest rate 5-year swap to replicate the analysis, the inflation component has risen from 2.00% to 2.24%, a 12% increase in the fear factor. The real yield component has increased from 0.51% to 0.71%, a 39% rise in greed [See Charts of the week].
Global headline inflation is now running close to pre-pandemic levels, while core prices continue to moderate but at a much more gradual rate, reflecting tight labour markets and service inflation.
The stickiness of core prices is a concern and could lead to divergence between central banks in the timing of rate cuts. A reminder of this came with the release of March data for the US Personal Consumption Expenditure Price Index, the Federal Open Market Committee’s (FOMC) preferred pricing measure, which remained unchanged on an annualised basis from February at 2.8%.4 Investors also need to consider the upside risk to goods prices if the Middle East conflict continues to escalate.
However, the larger driver of rising yields this year has been the growth component. Global manufacturing has now started to expand, as indicated by the JP Morgan Global Manufacturing Purchasing Managers Index moving into expansionary territory alongside the already growth-supportive, but inflationary, service sector.5 As we noted in our last Weekly Comment, Chinese growth in the first quarter surprised to the upside while the US economy continues to defy gravity.
Signs of life in laggard economies
Although first quarter growth for the US of 1.6% was well down on consensus expectations of 2.5%,6 this was attributable to a deceleration in government spending, net exports and inventories. More positively, private domestic demand (consumer and investment ex-inventory) grew 3.1%. The FOMC will likely be pleased to see federal government spending fall 0.2% in Q1 from the previous quarter, the first quarter-on-quarter decline for two years. This is often cited as one of the reasons restrictive monetary policy is taking longer than expected to have the desired effect.
We are also now starting to see growth pick up in laggard economies. The UK economy reported growth for a second month in a row in February,7 adding to hopes the shallow technical recession the country entered at the end of last year is over.
Recovery is also underway in Europe’s largest economy, Germany, which avoided a winter recession thanks to a pick-up in manufacturing and exports. Further confidence the economy has bottomed out can be taken from the latest IFO Business Climate Index, which showed business sentiment improving to its highest level in a year.8
So long as growth greed outweighs fear, risk assets should continue to perform. Investor confidence in central banks appears strong for now, as fears of a recession triggered by monetary tightening have dissipated. While the last mile of getting inflation back to target is still a concern, central banks will be relieved to see real yields rising and the supportive growth environment that gives them extra time to hold policy restrictive.
Charts of the week: Growth driving 5-year government bond real yields higher
Figure 1: US five-year inflation versus real yield (per cent)

Figure 2: EU five-year inflation versus real yield (per cent)

References
1.CBOE, as of April 26, 2024
2.Inflation plus real yield = nominal yield
3.(2.45 – 2.15)/2.15 = 14%
4.Bureau of Economic Analysis, as of April 26, 2024
5.JP Morgan, S&P Global, as of April 2, 2024
6.Bureau of Economic Analysis, as of April 25, 2024
7.Office for National Statistics, as of April 12, 2024
8.IFO Institute, as of April 26, 2024
Past performance is not a reliable indicator of current or future results
This material is not intended to be relied upon as a forecast, research, or investment advice, and is not a recommendation, offer or solicitation to buy or sell any securities or to adopt any investment strategy. The opinions expressed by Muzinich & Co. are as of April 29, 2024, and may change without notice. All data figures are from Bloomberg, as of April 26, 2024, unless otherwise stated.

