Covid-19 Index: Activity Recovers as Omicron Fades

Covid-19 Index

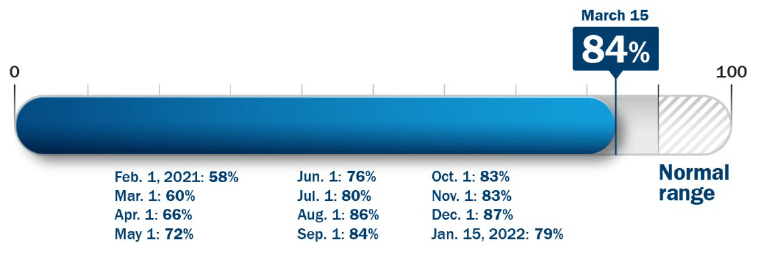
At the beginning of 2021 we created a Return to Normal Index to measure human activity data relative to pre-Covid levels as we progress through recovery. The index is constructed by our data scientists and fundamental analysts and tracks activities in the US including travel, returning to work and school, brick-and-mortar shopping and eating out at restaurants. It is focused on measuring components of daily life rather than economic indicators like GDP growth, and the percentage level moves closer to 100 as daily life normalises. We provide updates on the index when significant changes occur.

What has changed?

A sharp decline in Omicron cases, hospitalisations and deaths in the US is emboldening leaders to remove mask mandates and driving individuals to resume normal activity. In addition to the rapid decline in cases, health leaders evaluated the strong protection created by widening levels of immunity. Across all the categories we track we have seen an improvement of the low levels seen earlier this year, with travel and entertainment activity seeing the greatest gains since our last published update. Restaurants, cafes and events are back – or close – to normal, and air travel and lodging have improved significantly. Return to work activity has lagged in its improvement, but the resumption of corporate initiatives encouraging workers to return to offices, even if on a hybrid schedule, is accelerating. That said, an enduring change out of the pandemic may be a new work from home/work from office balance.

Source: Columbia Threadneedle Investments, 15 March 2022

What are we monitoring, and where is it at?

We’re analysing the time people spend engaging in a broad set of activities outside their homes. The index components have implications for economic growth, but the primary objective is to monitor how close or far we are to returning to normal life.


Our index suggests that we are 16% below pre-Covid activity levels. There is a wide variation in activity on a state-by-state basis (Figure 2). By geography, the central inland states are largely at the normal range. Some coastal areas have been slower to rebound to pre-pandemic levels of activity, for example, Washington DC, New York and Washington state.
 

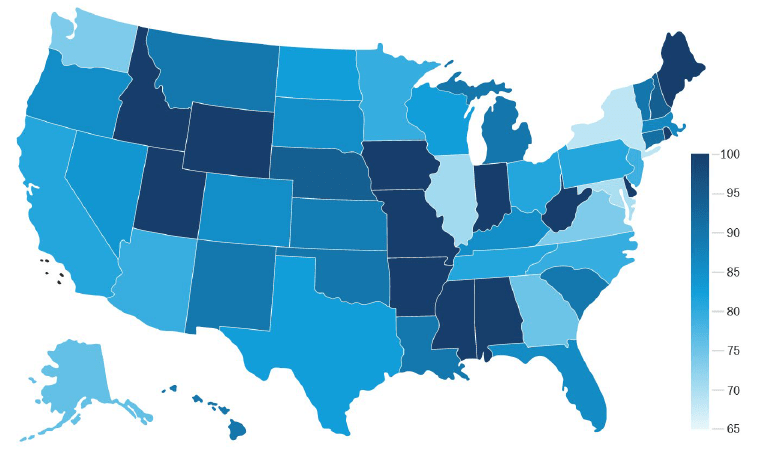
Figure 2: Return to normal state level index

Source: Columbia Threadneedle Investments, as at 15 March 2022. State level RTN data excludes air travel and school attendance data

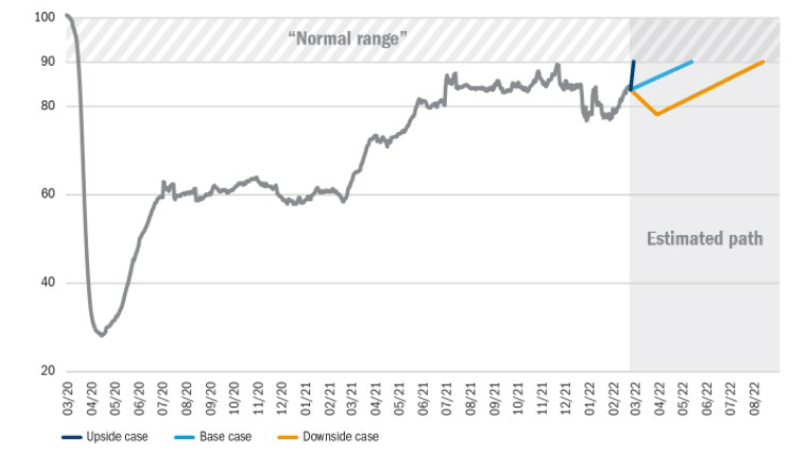
What could drive change?

As we enter the endemic phase of Covid, we will live with it and vaccinate against it like the flu. While immunity levels across the country are generally high, either through vaccination, exposure or both, there is still risk that a new variant could cause cases to rise again. Maintaining immunity, through greater uptake of boosters, will be critical to maintaining forward momentum in activity levels and dampening the impact of future variants. As restrictions continue to be lifted and we become reaccustomed to public life we expect activity to rise further.
 

Figure 3: The Return to Normal Index over time – level as of 15 March: 84%

Source: Columbia Threadneedle Investments, 15 March 2022
As a reminder, we don’t expect all levels of activity to return to their pre-Covid levels. The index could hit “normal” at a point lower than 100 because of prolonged changes in behaviour like working from home. This is why our normal range begins at 90%.
 
Our index continues to provide a framework as we analyse companies. It is a roadmap for what normal activity might look like post-Covid and how long it will take to get there. The information allows us to test a company’s own assumptions and make adjustments in our views as needed.
 
For investors, the Columbia Threadneedle Return to Normal Index can act in the same way: it’s an additional input to consider as they research their individual asset allocation and portfolio decisions.

Leave a Reply

Your email address will not be published. Required fields are marked *