

Brent Olson and Tom Ross, corporate credit portfolio managers on our Global High Yield platform, explore how factors affecting credit risk in high yield bonds might help balance upward pressure on interest rate risk.
Key takeaways
- Rises in interest rates denote not just inflation concerns but a recognition by central banks that the economy is healing.
- Credit fundamentals among high yield bonds have improved, offering the potential for credit spreads to tighten and absorb some of the upward pressure on yields.
- High yield typically has a low duration (sensitivity to interest rates) and while the past is not always a guide, it has typically outperformed other fixed income asset classes in inflationary and rising rate periods.
A popular image when conveying risk in bonds is the see-saw – the pivoting plank found in children’s playgrounds whereby as one side goes down, the other side goes up. A few decades ago, these were often situated above concrete – children were made of sterner stuff back then, although memories of bruised knees and elbows might attest otherwise. Today, civic planners are kinder and soft sand or rubber normally breaks any fall.
Absorbing the impact
Typically, the see-saw is framed in the discussion of bond prices – as bond yields rise, prices fall and vice versa. But for high yield corporate bonds it is also a useful image for two of the key risks that face bonds – interest rate risk and credit risk. At a time when central bankers are turning more hawkish and are raising, or considering raising, rates (rising interest rate risk), can improving corporate conditions (declining credit risk) cushion the impact of rising rates?
First, it is important to establish that high yield bonds are typically less sensitive to interest rate changes than investment grade corporate bond and sovereign bond markets. Partly, this is structural; investors have traditionally been less willing to lend to riskier borrowers for longer periods so high yield bonds typically have shorter maturities – after all, why invite additional maturity risk (the wait to be repaid par value at maturity) when an investor is already taking greater risk at the credit level? Partly, it reflects the higher yields on high yield bonds, which essentially quickens the pace at which an investor is repaid their investment, particularly as the real value of coupon payments will decline over time in an inflationary environment. Taken together, shorter maturities and higher yields leads to lower average duration (interest rate sensitivity) on high yield bonds (see Figure 1).
Figure 1: Duration within fixed income markets
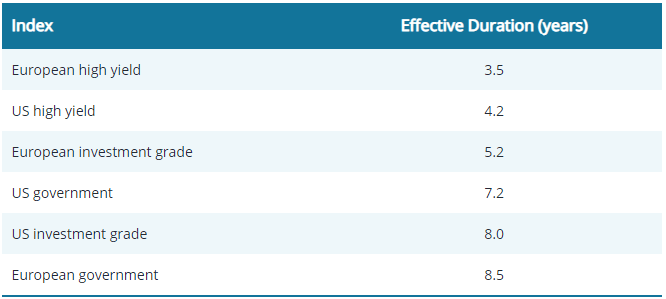
As a refresher, an effective duration of 3.5 years means that if there were to be a change in yield of 100 basis points, or 1%, then the bond’s price would be expected to change by 3.5%. Remember, when bond yields rise, bond prices fall and vice versa, so in a rising rate environment, a lower duration can be advantageous.
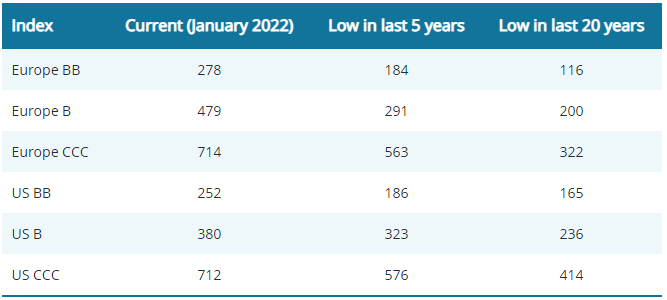
High inflation is clearly a concern for central banks and is driving their decisions to raise interest rates but allied to this is evidence of recovering economies that no longer need emergency support. Labour markets are buoyant, earnings are growing, and supply chains are beginning to repair. Asset markets have a tendency to predict the future and high yield bond markets have been registering this improvement for some time. Credit spreads (the additional yield over government bonds of similar maturity) have tightened considerably since their wides at the height of fears around the COVID pandemic but still offer room for further tightening (see Figure 2).
Figure 2: Current spreads (basis points) are above lows, offering room for tightening
Through tightening, credit spreads can potentially absorb some of the rise in yields on government bonds. We also argued last year that quality improvements within the high yield market alongside a low default environment could potentially allow for spreads to break through their lows. Expectations from the credit rating agencies are that the percentage default rate globally will remain low; for example, S&P Global Ratings envisages the global speculative grade default rate to be near historical lows in the first half of 2022 – possibly below 2% – before rising later in the year but only slightly.1
Of course, we are mindful that the high yield market is at the mercy of events. For now, heightened risk aversion due to geopolitics and central bank policy mean spread tightening faces a headwind. Central banks have been caught on the hop by inflation proving more elevated and persistent than they previously expected. Having been potentially slow to act, they may now feel pressured to be seen to be doing something. For the US Federal Reserve, in particular, having pivoted so sharply in the fourth quarter of 2021 it is unlikely they will soften their new hawkish tone in the next few months unless there are clear signs of inflation or economic data rolling over. This could make for a rocky few months in markets, although this is not necessarily a bad thing for an active investor as it can create opportunities.
Strong fundamentals
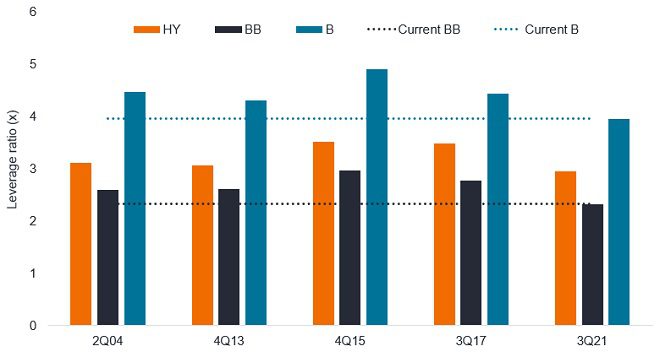
The pandemic was a shock that forced many issuers to tap capital markets for financing but underlying credit fundamentals among high yield borrowers have improved dramatically since. The leverage ratio, which is total debt divided by earnings before interest, tax, depreciation and amortisation (EBITDA), initially soared as borrowings rose and earnings fell. That dynamic has now reversed as companies pay down debt and earnings rise. Net leverage (where total debt is reduced by cash and cash equivalents on the balance sheet) has also shrunk as emergency cash originally earmarked to cover costs from revenue shortfalls has turned into cautionary cash. Such has been the improvement that Morgan Stanley noted that high yield leverage in the US has never been lower entering a monetary tightening cycle in the last two decades (see Figure 3)
Figure 3: US high yield net leverage never been lower entering a recent tightening cycle
The improved earnings and low financing costs means that the interest coverage ratio (EBITDA/total interest expense) remains near highs, so we anticipate most companies being in a strong position to service their debts, even as interest rates rise. On average across US high yield, interest coverage is at 4.9x (up 0.8x on a year earlier).2 Furthermore, many high yield borrowers have been refinancing their debt to lock in low rates. While new debt supply is expected to remain high this year, we anticipate it being down on last year at a time when income yield will likely remain in demand, so the technical outlook appears favourable.
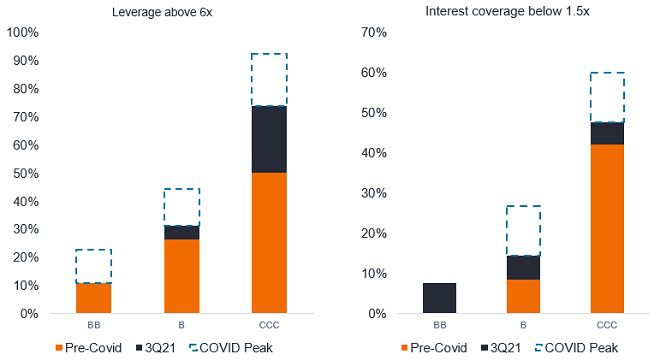
Not everywhere is rosy. Index averages can disguise underlying issues, which is why assessing credit fundamentals remains paramount. Stress remains concentrated in lower quality credits (see figure 4). Leverage levels across much of the market beyond CCC have returned to pre-COVID levels, but interest coverage levels lag the improvement in leverage levels.
Figure 4: Stress remains concentrated in lower quality credits (US high yield)
Percentage of overall index exhibiting high leverage or low interest coverage:
This marries with our view that BB rated bonds may be the area of high yield that offers the best risk-adjusted returns, not just because of stronger credit fundamentals but because this rating cohort is likely to remain popular with investment grade investors looking for extra yield as well as being a source of rising stars – issuers that are upgraded to investment grade.
Is inflation all bad?
With their mandates for price stability, central banks are responding to inflation through tighter monetary policy but inflation need not be a negative for investors. The sources of inflation are important. High yield as a universe has historically had a high weighting to materials and energy issuers, so higher commodity prices may ultimately help the cash flow of these companies. Clearly, there will be sectors of the market for which higher input costs exceed their capacity to pass on those costs – so it is important to look for companies with pricing power.
Historically, among the major fixed income asset classes, high yield has generally proven to be a good place to be in an inflationary environment (see Figure 5). Each inflationary episode is likely to be different, however, so investors should not rely on past trends being repeated.
Figure 5: US inflation rate and bond total returns during periods of rising inflation
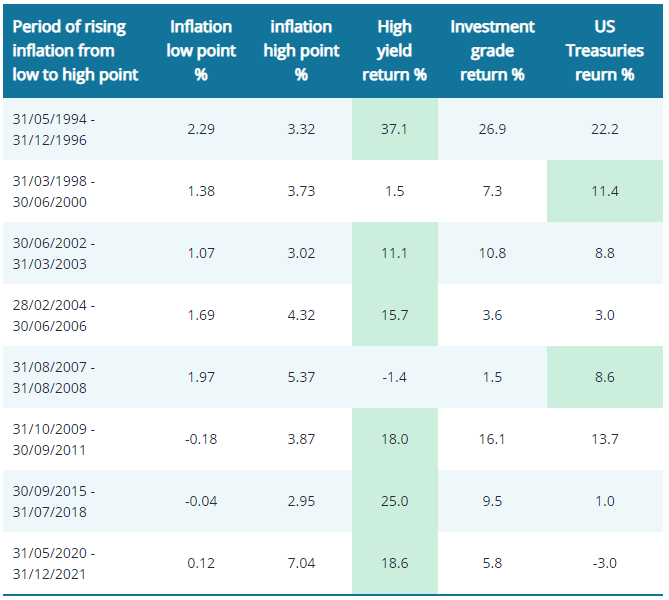
Past performance does not predict future returns.
A cautionary tale
Ultimately, there is no textbook answer to how economies will respond to emerging from a pandemic nor whether central banks are correctly assessing the current inflationary outlook. A potential risk is that if monetary policy is tightened too aggressively it could precipitate a recession. What is clear is that there is a shift in sentiment among central bankers as the emergency support that has characterised the past two years draws to a close.
Returning to our opening metaphor, the withdrawal of liquidity does not mean central bankers are about to replace the rubber matting beneath the see-saw with concrete, but investors will need to be more careful. Falls could be more painful as shown by the volatility in markets in January 2022, both in equities and bonds. For high yield, we take some comfort from the fact that rate rises also indicate growing confidence in the economy’s capacity to stand on its own two feet. Declining credit risk among selected high yield bond issuers we believe could help to offset some of the pressure from rising government bond yields.
1Source: S&P Global Ratings, Global Credit Outlook 2022, December 2021. Forecasts are estimates and are not guaranteed.
2Source: Morgan Stanley, US high yield interest coverage ratio at Q3 2021, 21 January 2021.