
History shapes our views and we are always seeking analogs comparable to current events. Even if we know that ‘past performance is not indicative of future performance’, we are still comforted when we draw parallels to the past. Many are now drawing parallels of the current tech enthusiasm to the dawn of the internet.
The quintessential example of a ‘bubble’ occurred in the late 1990’s. Some hallmarks of that time:
- When companies put the suffix ‘.com’ on their names, their share prices soared. Any company can do this and it has nothing to do with any real business prospects or potential.
- With the absence of profits or even sales, new metrics were created to make the case for progress in businesses like webpage visits or clicks.
- Many of the leading internet companies did not have positive earnings but, even in the more established S&P 500 which required profitability to get included, we approached price levels of 100x earnings for many large cap names. Hundreds of billions of dollars of market capitalisation was supported by dreams of wild future profits.
And for what is happening in the first half of 2023:
- There are companies putting ‘AI’ (artificial intelligence) into their names, but it is not yet a huge number and, alongside this, the transition of big numbers of private companies tapping the public markets has not yet happened. Additionally, companies putting AI into their names have real business reasons for doing so.
- Naturally, investors will look to track measures like the intensity with which firms are using AI or engaging with data. Because people remember the 2000-02 ‘Tech Bubble’ period, we doubt that investors will also then say that ‘earnings don’t matter’ or ‘revenues don’t matter’—or at least that could still be some time away.
- When people look at how the big indices, like the Nasdaq 100 Index and the S&P 500 Index, are being driven higher by the largest companies, we see that all of those large companies are ‘real businesses’. They have revenues, they have cash flows, and they have earnings. It’s absolutely true that investors might look at Nvidia, as an example, and think that the multiple is too high for the growth that they expect to see—but it’s not a case where Nvidia is selling the dream of making a chip one day. Nvidia chips exist, they are sold, and Nvidia is the clear leader in providing the graphics processing units (GPUs) that allow AI to run.
Even if the market could very well be ripe for a near-term correction after a nearly 6-month run, and even if that run was accompanied by a hype cycle in AI, we are not seeing signals that the broad technology focused stocks are in bubble territory.
Let’s look at some numbers
During the ‘Tech Bubble’ investors decided to not consider the classic statistics. We will not make that mistake here. Looking at Figure 1:
- We create a view of the ‘Expanded Tech’ sector. Companies like Meta Platforms and Alphabet are in ‘Communication Services.’ Amazon.com (even accounting for that .com suffix) is in ‘Consumer Discretionary’. Information Technology includes Microsoft and Apple. If we use this ‘Expanded Tech’ designation, we capture a broader cross section of technology.1
- In 1998-2000, roughly speaking, this index was hitting a forward P/E ratio2 of more than 55x. The initial run up was based on prices and euphoria—the second spike into the 50x range would have been from the quick drop in forward earnings expectations when the popping of the bubble was clear.
- Looking at what the same Index is currently trading at in terms of forward P/E present, it is still below 30x. 28.4x is not ‘cheap’, so we are not seeking to indicate that tech is currently cheap in any way.
- Back in 2000, real interest rates were higher. However, we would note that this multiple expansion has occurred alongside a higher interest rate environment—not always an easy feat for stocks to achieve. Back in 2000, when the tech sector was over 55x forward earnings, real interest rates (measured by TIPS bonds) were double where they are currently.
Figure 1: S&P 500 expanded tech forward P/E ratio over time
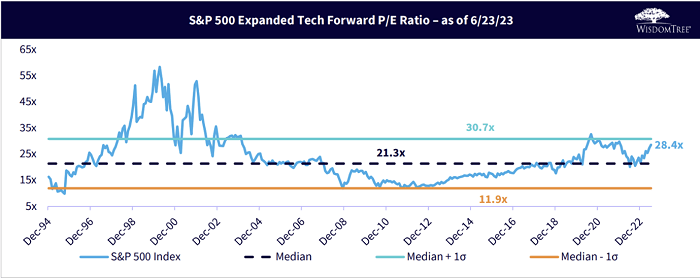
Source: https://www.wisdomtree.com/-/media/us-media-files/documents/resource-library/daily-dashboard.pdf, with data sourced from WisdomTree, Factset and S&P. Historical forward P/E measured since December 31, 1994. Expanded Tech includes the Information Technology sector, the Interactive Home Entertainment sub industry, Interactive Media & Services sub industry, Amazon.com, Etsy, and Netflix. You cannot invest directly in an index.
Historical performance is not an indication of future performance and any investments may go down in value.
Then, in Figure 2:
- We can see how the ‘other stocks’ that are not tech have been doing by way of valuation. These other stocks never broke a 30x forward P/E ratio during the tech bubble.
- The current valuation of the ex-tech part of the S&P 500 is at 16.7x, and is very close to the average over the full period. This is not ‘cheap’, but certainly not getting into the more expensive territory.
Figure 2: S&P 500 ex-tech forward P/E ratio over time
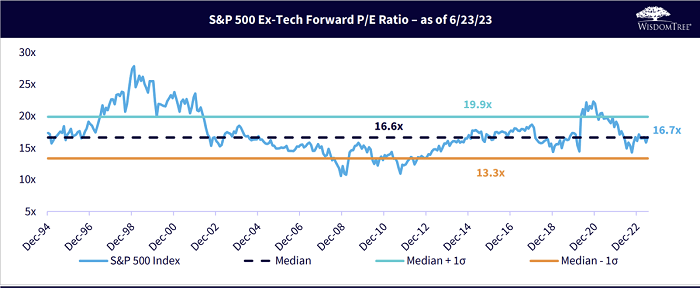
Source: https://www.wisdomtree.com/-/media/us-media-files/documents/resource-library/daily-dashboard.pdf, with data sourced from WisdomTree, Factset and S&P. Historical forward P/E measured since December 31, 1994. Ex-Tech excludes the expanded tech companies which are included in Figure 1. You cannot invest directly in an index.
Historical performance is not an indication of future performance and any investments may go down in value.
The bottom line: a bubble is not just ‘a bit expensive’ but, rather, a bubble represents a situation where there is a clear case that prices have gone extremely far beyond fundamentals. Forcing ourselves back to a classic figure, forward P/E ratio, we don’t see evidence of that being the case.
Dealing with the AI hype cycle
Still, we understand that performance in thematic equities can come in waves. One way to deal with these waves is to allocate to certain themes and then recognise that, over a cycle (something closer to 10 years than 5 years), there are going to be periods of strongly positive and strongly negative returns.
In many cases, knowing whether the themes are working or not is something completely different from looking at the share price performance. What we know today is that, in the current quarter, Nvidia is expecting revenues in the range of $11 billion USD3. It will be critical to watch that trajectory, which then indicates a 12-month run rate above $40 billion. Do we actually see that materialise? Similarly, companies like Microsoft and Alphabet will continue to talk about the topic and launch new options for their customers. These are the kinds of things that we can honestly see and monitor.
Signals of a greater degree of froth could entail seeing a much more robust IPO (initial public offering) market in specific AI companies, which may happen in the future but is not here yet. We are not saying that one day there cannot ultimately be a bubble—we are all still human, and human behaviors create bubbles—but what we are seeing at this moment is not yet there.
Sources
1 This is akin to older definitions of the section before GICs made some changes to internet and communications stocks.
2 P/E ratio = price to earnings ratio.
3 Source: Factset, as of Nvidia’s earnings guidance given on their Q1 2023 earnings call.