
Thematic investing is a long-term endeavour. The performance potential of such an investment is the consequence of worldwide, structural changes that can span decades. However, those changes do not happen linearly over time, they tend to go through fits and starts. Looking back over the last few years, it is easy to see how this phenomenon applied to cloud computing in 2020 and artificial intelligence (AI) more recently. For investors, this means that each theme is driven by theme-specific events (such as a technological breakthrough) and theme-specific news.
By using theme-specific information, investors could then improve their thematic portfolio’s risk-return profile over time. Over-weighting cloud computing early in 2020, just before the COVID-19 rebound, and under-weighting in 2022, would have been very beneficial for example. Overweighting AI in November 2022, when ChatGPT launched, would also have worked very well.
Is price momentum an indicator of tailwinds or headwinds in a theme?
While tracking specific events and technological developments for ten or twenty themes is not feasible for most investors, price momentum could be an indicator that something is happening with a given theme. In the following, we try three different momentum signals:
B. Trend scanning: A popular signal that consists of calculating the t-value of linear regression on the historical price series for a large group of look-back windows (starting today). In more detail, we run a linear regression of, say, the last 12 weeks of price performance. This linear regression can be more or less statistically significant and, therefore, the t-value of the regression can be higher or lower. We then store the t-value. Then we run the regression for the last 13 weeks and store the t-value. And so on until we’ve run the regression for the last 60 weeks. The highest stored t-value in absolute terms is the signal and represents the historical regression that was the most statistically significant. If the theme goes through a trend, one or more regressions will have a high t-value. If not, the t-value will be low. In other words, the signal is very strong if there is at least one period ending today where the historical series is very ‘trended upward’.
C. Trend breadth: A popular signal that consists of calculating linear regression on the historical price series for a large group of look-back windows starting from today (exactly like in trend scanning). However, instead of storing the t-value, the sign of the slope coefficient is stored. The proportion of regressions with a positive coefficient represents the signal. In other words, the signal is very strong if there are many periods ending today where the historical series trended upward.
To test those three signals, we devise a simple technique. First, we create a benchmark designed as an equal-weight basket of all the themes existing at the time of rebalancing (weekly rebalancing). We then create three strategies where the portfolio invests in an equal-weight basket of themes but only a selection of them. At each rebalancing, the portfolio invests only in the 40% of the themes with the best momentum signals.
Figure 1: Three momentum-driven strategies investing in multiple themes
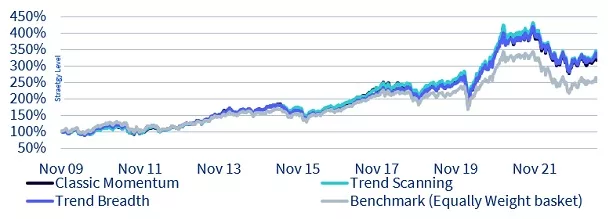
Sources: WisdomTree, Morningstar, Bloomberg. From 27/11/2009 (first day where at least ten themes have data) to 30/06/2023. Returns are calculated in US dollars on a weekly basis. The weekly performance of each investment theme is calculated as the average monthly performance of every fund live at that point in time and classified in the theme, as explained in the Appendix. Historical performance is not an indication of future performance and any investments may go down in value.
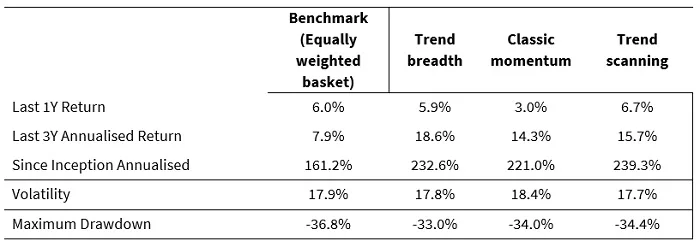
We observe that all three momentum strategies significantly outperform the equal-weight benchmark. Also, all three strategies deliver lower drawdown over the full period. This translates, of course, into a significantly improved risk-return profile for the investor.
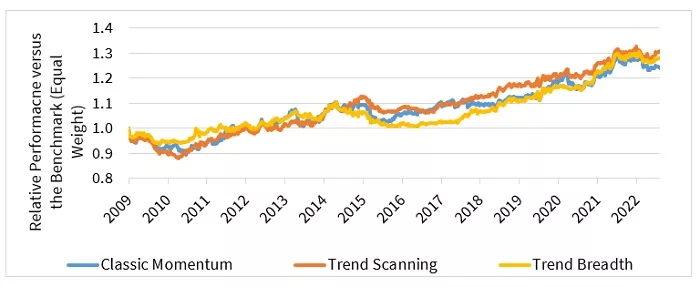
What is particularly interesting is that the relative performance versus the equal-weight portfolio is very stable (that is, the line in the bottom graph is rising gradually). Except for a period around 2017/2018 where the performance merely matched the benchmark’s, most other periods show outperformance.
Conclusion
These analyses underscore the potential for alpha generation by using momentum signals for the tactical trading of thematics. While thematic investments are long-term endeavours, a tactical overlay using momentum can help create extra performance in a multi-thematic portfolio and this is where investors can use theme-specific dynamics to their advantage.