
After posting a strong performance in 2022, buoyed by the performance of energy stocks, the FTSE 100 is having a more difficult 2023. While the S&P 500 is up 13.7%1, the FTSE 100 has only gained 5.4% year to date.
WisdomTree’s founding philosophy is to be a financial innovator and offer investors innovative, value-add strategies. Within equities, WisdomTree is one of the pioneers of factor investing, having launched among the first smart beta exchange-traded funds (ETFs) in the world. Today, we have launched the newest addition to our Quality Dividend Range to serve investors seeking exposure to the UK: the WisdomTree UK Quality Dividend Growth UCITS ETF.
Quality Dividend Growth: investing in the market for the long run
The Quality Dividend Growth range is our flagship equity range, offering a core equity solution for investors’ portfolios. With more than 10 years of live history and $14.52 billion of assets under management (AUM) across wrappers and geographies, this strategy is used by a large range of our clients, from wealth managers and private banks to asset managers and pension funds.
In Europe, the range is comprised of 3 ETFs, launched in June 2016, focused on developed equities, US equities and eurozone equities. All three ETFs have outperformed the market after fees, leading to excellent Morningstar ratings and decile ranks. Investors have also voted with their feet; the UCITS range total AUM is $1.2 billion2 with year-to-date (YTD) flows totalling $316 million2.
Figure 1: WisdomTree Quality Dividend Growth ETFs range live historical outperformance
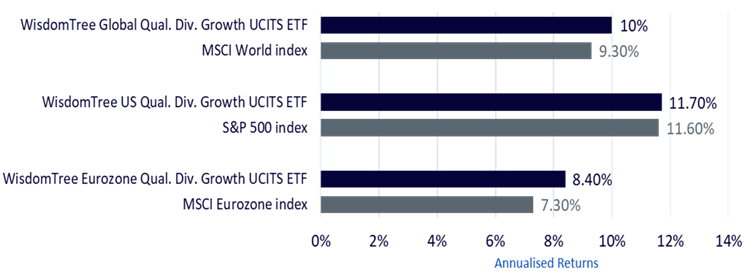
Source: WisdomTree, Bloomberg. Period from 29 June 2016 to 30 September 2023. Calculations are based on daily NAV.
Historical performance is not an indication of future performance and any investments may go down in value.
The WisdomTree UK Quality Dividend Growth UCITS ETF is our latest addition to the range and our goal is to bring the success of this franchise to UK equities. The ETF follows the overarching principles of the rest of the family, focusing on high-quality, dividend-growing companies that have delivered strong resilient outperformance to our investors.
WisdomTree UK Quality Dividend Growth UCITS ETF
With the WisdomTree UK Quality Dividend Growth UCITS ETF, investors can benefit from WisdomTree’s transparent and systematic investment process rooted in academically driven research. The ETF delivers consistent exposure to the profitability factor with high active share.
1. The portfolio of the ETF is constructed around a universe of dividend-paying companies domiciled and listed in the UK with a dividend coverage ratio of at least one, minimum market capitalisation of 200 million US dollars, as well as average daily volume of 250,000 US dollars to ensure liquidity.
2. Companies breaching the WisdomTree ESG framework are excluded from the eligible investment universe.
3. The riskiest companies (according to WisdomTree’s Composite Risk Score, a mix of momentum and quality metrics) are also excluded.
4. The portfolio consists of a diversified basket of 100 companies with the best combined score using three fundamental metrics3 that we believe best represent high-quality companies with the potential to grow their dividends in the future:
+ ROE (Return on Equity)4, 5
+ ROA (Return on Asset)4
+ Analysts’ earnings growth expectations, EBITDA growth and Sales Growth
5. The final step in the process is that the 100 selected companies are ‘dividend stream’ weighted – the weight for each stock is derived from the amount of dividends paid by the company over the previous 12 months in US dollar terms (dividend per share x number of shares outstanding). This weighting methodology takes into account the size of the company and controls the valuation of the portfolio by ensuring that the strategy is not focusing on overpriced stocks
A closer look at the WisdomTree UK Quality Dividend Growth UCITS ETF’s portfolio
The portfolio resulting from this process is highly geared towards high-quality stocks. The portfolio’s return on equity is 34.7 versus 14.8 for the FTSE All Share and 17.9 for the FTSE 100. The return on assets is also 3 times higher than those of the 2 benchmarks. Valuation-wise, the portfolio is marginally more expensive than the benchmark’s with less than 1 point of price-to-earning ratio’s delta.
Figure 2: WisdomTree UK Quality Dividend Growth UCITS ETF – key fundamentals
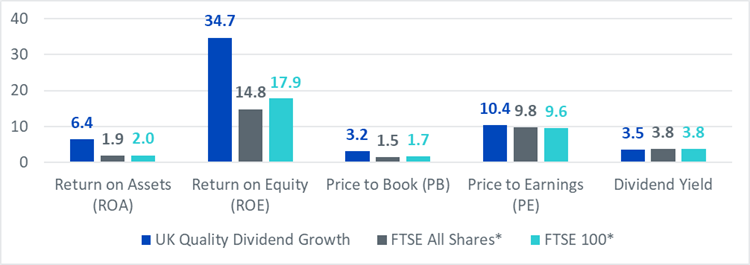
Source: WisdomTree, FactSet. As of 29 September 2023. The FTSE All Shares* is proxied by SPDR FTSE All Shares ETF. The FTSE 100* is proxied by HSBC FTSE 100 ETF.
Historical performance is not an indication of future performance and any investments may go down in value.
Sector-wise the portfolio tilts toward Industrials and Consumer Discretionary. Consumer Staples and Energy are underweight.
Figure 3: WisdomTree UK Quality Dividend Growth UCITS ETF – top 10 holdings and sector exposure
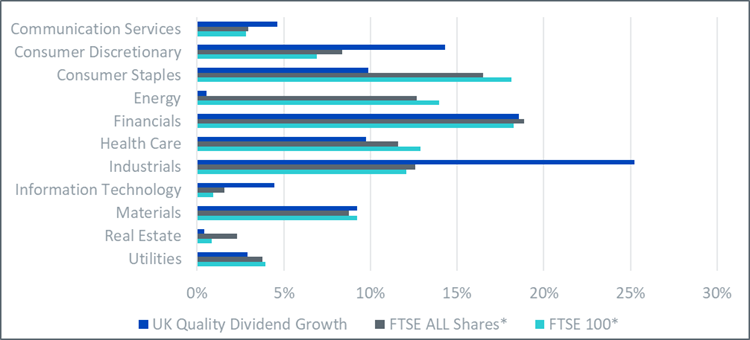
Source: WisdomTree, FactSet. As of 29 September 2023. The FTSE All Shares* is proxied by SPDR FTSE All Shares ETF. The FTSE 100* is proxied by HSBC FTSE 100 ETF.
Historical performance is not an indication of future performance and any investments may go down in value.
Looking at the stock holdings, the portfolio holds 100 names with an average market cap of $6 billion. The 6 biggest stocks are AstraZeneca, Relx, Unilever, Diageo, GSK and Rio Tinto.
Figure 4: Top 10 stocks
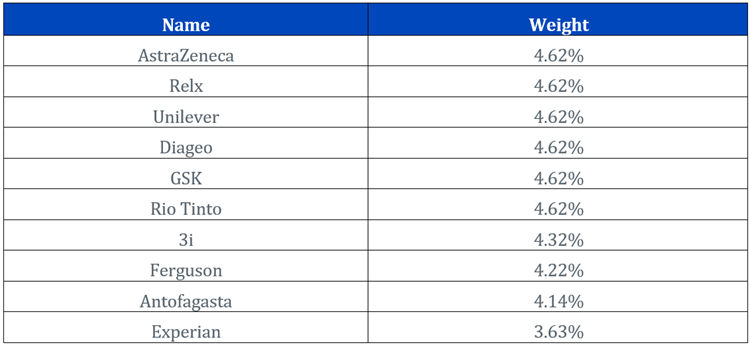
Source: WisdomTree, FactSet. As of 29 September 2023.
Historical performance is not an indication of future performance and any investments may go down in value.
Key takeaways
The WisdomTree UK Quality Dividend Growth UCITS ETF offers UK investors the opportunity to invest in their home market through a value-add strategy that has proven its worth over many years and across multiple regions.
The ETF provides a high-quality equity exposure to the UK market, aiming to deliver outperformance through a research-driven, academically backed investment process. The resulting portfolio, mixing large caps from the FTSE 100 but also smaller caps from the FTSE all-Shares, exhibits strong quality features as well as reasonable valuation metrics.
Sources
1 Source: Bloomberg, WisdomTree. From 31 December 2022 to 13 October 2023. Historical performance is not an indication of future performance and any investments may go down in value.
2 Source: WisdomTree. As of 6 October 2023.
3 All data is sourced from FactSet.
4 Historical three-year average is used.
5 Companies with negative equity and therefore undefined return on equity are given a median score as long as they’ve shown dividend growth over the past five years.