
After a very strong 2021, the crypto market has fallen dramatically in the first month of 2022. Bitcoin is now trading just above the $35k mark, down close to 50% from its all-time price of $68k reached as recently as November 2021.
Some see here a pattern linked to bitcoin’s halving cycle. Bitcoin’s block subsidy, the amount of bitcoin created with each new validated block, is cut in half roughly every four years. In the three prior occurrences, this event has been followed by a strong bull market of roughly a year and a half, followed by a deep correction.
Figure 1: Bitcoin Price Action After Previous Halvings
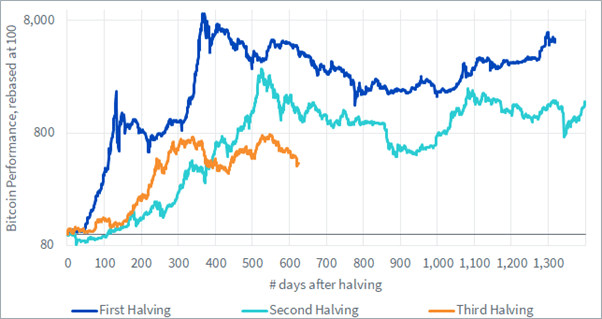
Source: WisdomTree. Data from 17 July 2010 to 8 July 2016 (First Halving), from 28 November 2012 to 10 May 2020 (Second halving), from 11 May 2020 (Third Halving) to 27 Jan 2022.
Historical performance is not an indication of future performance, and any investments may go down in value.
The dynamics of such price cycles, if they do exist, are not known. However, as this narrative has been around for years in the crypto space, this may have become a self-fulfilling prophecy.
The other main explanation for the drop relates to the current macroeconomic backdrop. In the aftermath of the Covid pandemic, inflation rose in all major economies. This has led the US Federal Reserve to hint for multiple rate hikes in 2022, and market expectations for the number of such hikes in 2022 keep rising. In these circumstances, stocks have been suffering over the past couple of weeks, with some indices entering a correction. The Nasdaq has lost -13.2% year-to-date1.
The past couple of years has shown that stress in equity markets translates into stress in the crypto market. They are both risk-on asset classes, and they tend to fall together when consensus worsens significantly. Crypto remains a much more volatile asset, with high levels of leverage, and it is not surprising to see digital assets move down to a larger extent than stocks.
Having said that, the crypto market also tends to decorrelate quickly from equities after such downturns. The challenge is then to try and determine when the market is settling down near the bottom.
Many crypto-related metrics can help us assess whether the market is overheating or overly bearish. Metrics derived from the derivatives market are very useful in that regard. For example, investors can use the perpetual futures funding rate to indicate whether the market is currently bullish or bearish. The funding rate is a built-in feature of perpetual futures, which aims to prevent perpetual futures from deviating too much from the spot market. When the rate is positive, long holders make a periodic payment to short holders. Typically, when the market is bullish, long demand for leverage is strong, driving the price of futures up and driving the funding rate higher too.
This rate is positive the vast majority of the time. It only turns negative under strong shorting pressure. Historically, it’s been a reasonably good indicator that the market was close to a bottom, although the history available for this metric is quite limited.
Figure 2: Perpetual Futures funding rate
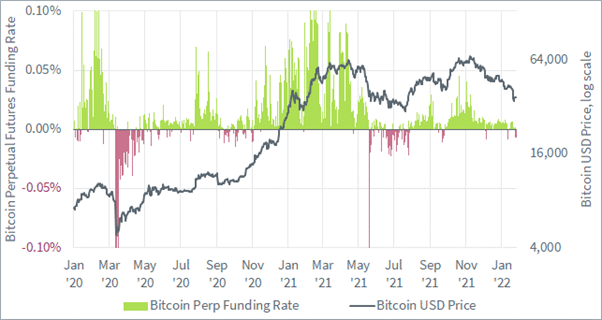
Source: WisdomTree. Data from 31st December 2019 to 26 January 2022..
Historical performance is not an indication of future performance, and any investments may go down in value.
We are already starting to see the funding rate go into negative territory. Should it remain so for a few days or weeks, this could indicate that the market is settling down. But we expect the crypto market to remain sensitive to significant changes in macro expectation in the short-term, both on the positive and negative side.
Source
1 As of 26 January 2022.